FIGURE 13:
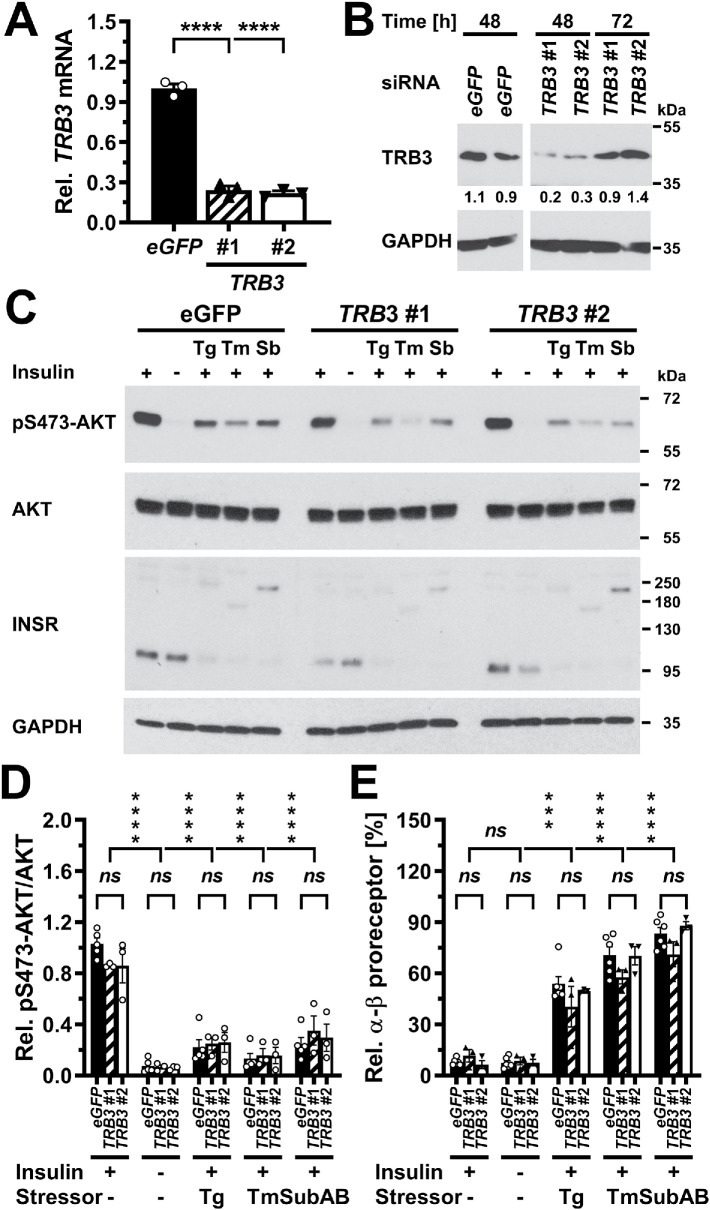
TRB3 is not required for development of insulin resistance in ER-stressed C2C12 cells. (A) siRNA-mediated knockdown of TRB3 at the mRNA level 48 h after transfection of C2C12 cells with 50 nM of the indicated siRNAs. TRB3 mRNA was determined by reverse transcriptase-qPCR and normalized to ACTB. Bars represent the SE from three technical replicates. p values were calculated by ordinary one-way ANOVA with Dunnett’s multiple comparisons test. (B) siRNA-mediated knockdown of TRB3 at the protein level 48 and 72 h after transfection of C2C12 cells with 50 nM of the indicated siRNAs. (C) Twenty-four hours after transfection with the indicated siRNAs, C2C12 cells were exposed to 300 μM thapsigargin, 1 μg/ml tunicamycin, or 1 µg/ml SubAB for 24 h and serum-starved during the last 18 h of exposure to ER stressors before being stimulated with 100 nM insulin for 15 min. Phosphorylation of AKT at S473 and insulin receptors were analyzed by Western blotting. (D) Quantification of the relative phosphorylation of AKT at S473 in the Western blots of panel C. Bars represent SEs (n = 5 for cells transfected with siRNAs against eGFP, n = 3 for all other samples). p values were calculated by ordinary two-way ANOVA with Dunnett’s correction for multiple comparisons. (E) Quantification of the relative abundance of α-β proreceptors in the Western blots of panel C. Bars represent SEs (n = 6 for cells transfected with siRNAs against eGFP, n = 3 for all other samples). p values were calculated by ordinary two-way ANOVA with Dunnett’s multiple comparisons test to compare of samples to the insulin-stimulated, unstressed sample and Tukey’s multiple comparisons test to compare different siRNAs.

