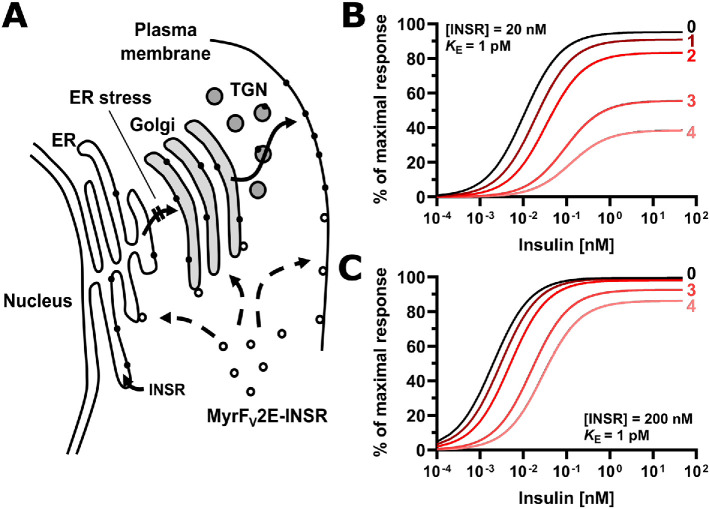
FIGURE 14:
ER stress decreases insulin sensitivity by decreasing the plasma membrane population of the insulin receptor. (A) Inhibition of insulin signaling by ER stress requires transport of newly synthesized insulin receptors from the ER to the cell surface. The signal peptide sequence targets ribosomes translating the insulin receptor mRNA to the ER, where the newly synthesized polypeptide chain folds into molecules with insulin-binding activity. ER stress interferes with folding of newly synthesized insulin receptor molecules, preventing its transport to the Golgi complex. The Myr-FV2E-insulin receptor chimera is not affected by ER stress because it is translated by cytoplasmic ribosomes and folds in the cytosol into active molecules thus bypassing the ER. Abbreviation: TGN, trans-Golgi network. (B, C) Modeling of the response to insulin as a function of insulin and insulin receptor concentration. The response to insulin, R, is defined by the equation R = Rmax·[INS·INSR]/(KE + [INS·INSR]), with KE the concentration of insulin (INS)-insulin receptor (INSR) complexes at which R = 0.5·Rmax, and Rmax the maximal response to insulin. The concentration of insulin–insulin receptor complexes is calculated from the equilibrium INS + INSR ↔ INS·INSR, considering only high affinity binding of insulin to the insulin receptor with a dissociation constant of 200 pM (Bass et al., 1996). KE varies widely for different physiological responses to insulin (Gammeltoft and Gliemann, 1973; Hofmann et al., 1980; Crettaz and Kahn, 1984) and has been assumed to be equal to 1 pM for illustrative purposes only. Numbers represent the half-lives of the insulin receptor at the cell surface that have elapsed since ER stress was induced.

