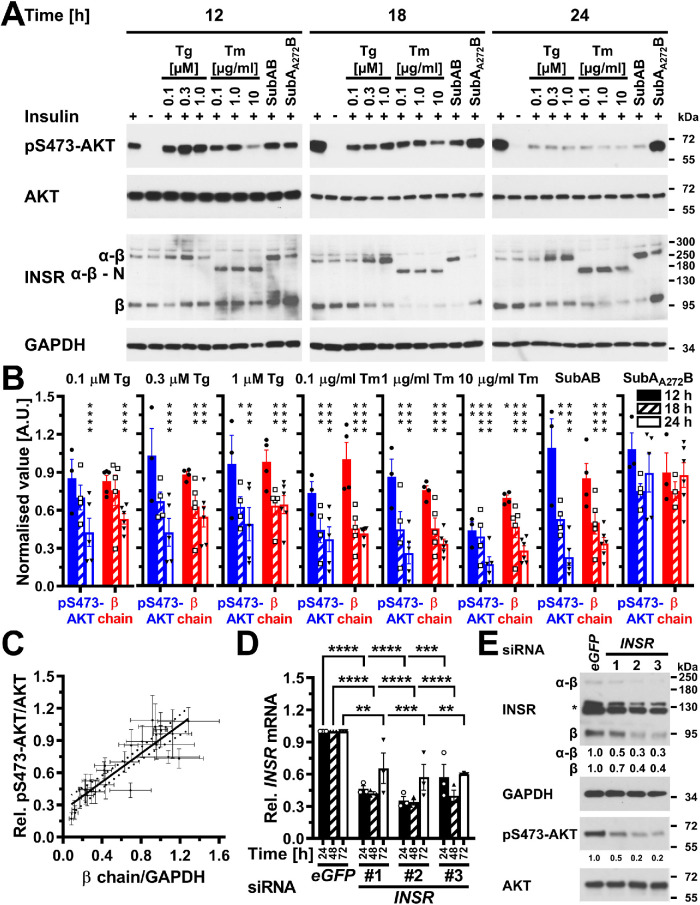
FIGURE 6:
Depletion of insulin receptors coincides and correlates with decreased AKT S473 phosphorylation in ER-stressed C2C12 myoblasts and suffices to decrease AKT S473 phosphorylation. (A) Serum-starved C2C12 cells were treated with the indicated concentrations of thapsigargin, tunicamycin, 1 μg/ml SubAB, or 1 μg/ml SubAA272B for 12–24 h before stimulation with 100 nM insulin for 15 min. Cell lysates were analyzed by Western blotting for pS473-AKT, total AKT, the insulin receptor (INSR), and GAPDH. Bands representing the α-β proreceptor, the unglycosylated α-β proreceptor, and the β chain of the mature insulin receptor are labeled α-β, α-β - N, and β, respectively. (B) Quantification of the phosphorylation of AKT on S473 (“pS473-AKT”) and of the relative abundance of β chains of the insulin receptor (“β chain”). Bars represent SEs (AKT phosphorylation at S473: n = 6 for cells stimulated with 100 nM insulin at the 12 h time points, n = 7 and 9 for the 18 and 24 h time points; for all other samples n = 3 for the 12 h time point, n = 4 for the 18 h time point, and n = 5 for the 24 h time point; relative abundance of β chains: n = 9 for cells stimulated with 100 nM insulin at the 12 h time point, n = 10 for the 18 h time point, and n = 12 for the 24 h time point, 12 h: n = 5 for the unstimulated cells and the insulin-stimulated cells treated with 0.1 mM thapsigargin, n = 3 for the cells treated with SubAA272B, and n = 4 for all other samples, 18 h: n = 6 for the unstimulated cells, n = 3 for cells treated with SubAA272B, and n = 5 for all other samples, 24 h: n = 6 for all samples). Phosphorylation of AKT at S473 and the relative abundance of β chains are expressed relative to unstressed cells that were stimulated with 100 nM insulin for 15 min. p values for comparison of ER-stressed to unstressed samples were calculated using ordinary two-way ANOVA with Dunnett’s multiple comparisons test on the original data for AKT phosphorylation at S473 and square root–transformed data for the relative abundance of β chains. (C) Correlation of insulin-stimulated AKT phosphorylation with insulin receptor β chains (r2 = 0.80, two-tailed p < 0.0001 for a significantly nonzero slope, and p > 0.05 for deviation from linearity calculated by a runs test, n = 27). Dotted lines represent the 95% confidence interval of the linear regression line. The relative phosphorylation of AKT at S473 shown in panel B was plotted against the relative abundance of β chains shown in panel B. (D) Steady-state INSR mRNA levels in C2C12 cells transfected with 50 nM of the indicated siRNAs for 24, 48, or 72 h. Bars represent SEs (n = 3). p values for comparison of cells transfected with the three INSR siRNAs to the cells transfected with the eGFP siRNA were calculated with an ordinary two-way ANOVA with Tukey’s multiple comparisons test. Differences in INSR mRNA levels between different INSR siRNAs within individual time points or between different time points for individual siRNAs are not significant. (E) siRNA-mediated knockdown of expression of the insulin receptor inhibits insulin-stimulated phosphorylation of AKT. Serum-starved C2C12 cells were stimulated with insulin 48 h after transfection of 50 nM of the indicated siRNAs. Two unspecific bands are marked with an asterisk (*).

