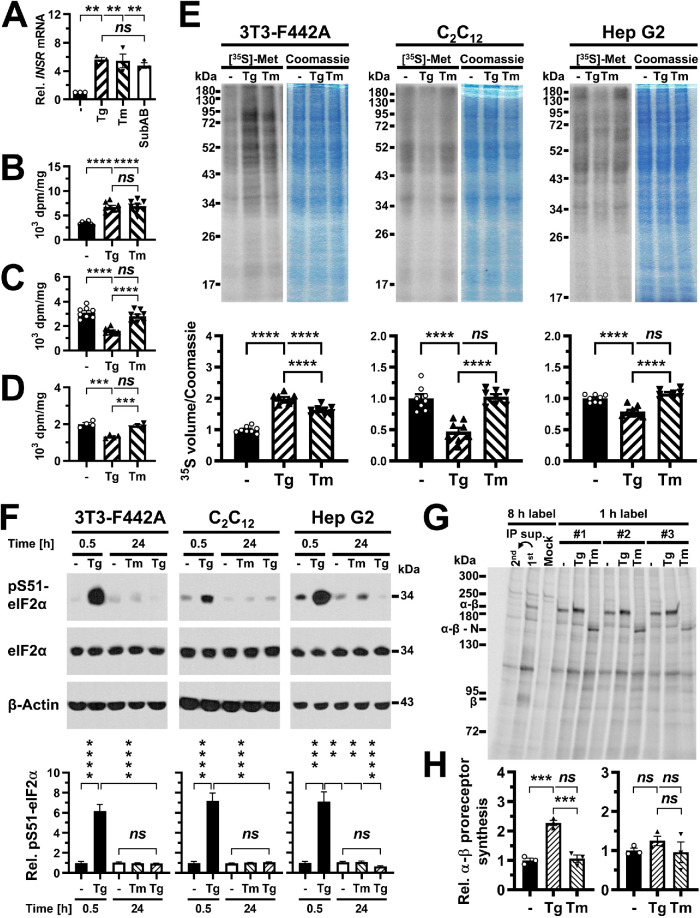
FIGURE 7:
Inhibition of insulin receptor synthesis at the transcriptional or translational level cannot fully account for decreased insulin-stimulated AKT S473 phosphorylation. (A) INSR mRNA levels measured by reverse transcriptase-qPCR in C2C12 cells treated with 300 nM thapsigargin, 1 μg/ml tunicamycin, or 1 μg/ml SubAB for 24 h. Bars represent SEs (n = 3). p values for comparison of ER-stressed samples to unstressed samples were calculated using ordinary one-way ANOVA with Dunnett’s multiple comparisons test. (B–D) Protein synthesis rates in (B) 3T3-F442A (n = 8), (C) C2C12 (n = 8), and (D) Hep G2 (n = 4) cells treated with 0.1 μM thapsigargin or 0.1 μg/ml tunicamycin for 24 h measured by incorporation of [35S]-L-methionine into protein. Protein synthesis rates were determined as TCA-precipitable counts standardized to total protein. Bars represent SEs. p values were calculated by ordinary one-way ANOVA with Tukey’s multiple comparisons test. (E) Protein synthesis rates in cells treated for 24 h with 0.1 μM thapsigargin or 0.1 μg/ml tunicamycin measured by storage phosphor analysis of [35S]-L-methionine incorporation into protein. For each cell line, the storage phosphor image of the SDS–PAGE gel is shown to the left and an image of the Coomassie Brilliant Blue R-250–stained gel is shown to the right. Quantification of [35S]-L-methionine incorporation into protein, expressed as the volume of the 35S storage phosphor signal relative to the Coomassie Brilliant Blue R-250 staining intensity is shown in the bar graphs below the gel images. Bars represent SEs (n = 8). p values were calculated by ordinary one-way ANOVA with Tukey’s multiple comparisons test. (F) Phosphorylation of eIF2α at S51 in 3T3-F442A cells (n = 13 for 0.5 h and n = 12 for 24 h), C2C12 cells (n = 21), and Hep G2 cells (n = 13 for 0.5 h and n = 8 for 24 h) exposed for 0.5 or 24 h to 0.1 μg/ml tunicamycin or 0.1 μM thapsigargin. The treatment with 0.1 μM thapsigargin for 0.5 h is a positive control for the pS51-eIF2α Western blots. Bars represent SEs. For 3T3-F442A cells, p values were calculated by Welch’s ANOVA with Dunnett’s T3 multiple comparisons test. For C2C12 and Hep G2 cells, p values were calculated by a Kruskal–Wallis test with Dunn’s multiple comparisons test. (G) Immunoprecipitation of the insulin receptor after a 1 h label with [35S]-L-methionine in 3T3-F442A cells. Thapsigargin was used at 0.1 μM and tunicamycin at 0.1 μg/ml. Abbreviations: Mock, immunoprecipitation with nonimmune IgG; 1st, immunoprecipitation of the insulin receptor after an 8 h labeling period; 2nd, immunoprecipitation of insulin receptors remaining in the supernatant of the 1st immunoprecipitation. #1, #2, and #3 indicate three biological repeats. (H) Quantification of newly synthesized α-β proreceptors in 3T3-F442A cells (left) and Hep G2 cells (right). Bars represent SEs (n = 3). p values were calculated by ordinary one-way ANOVA with Tukey’s multiple comparisons test.

