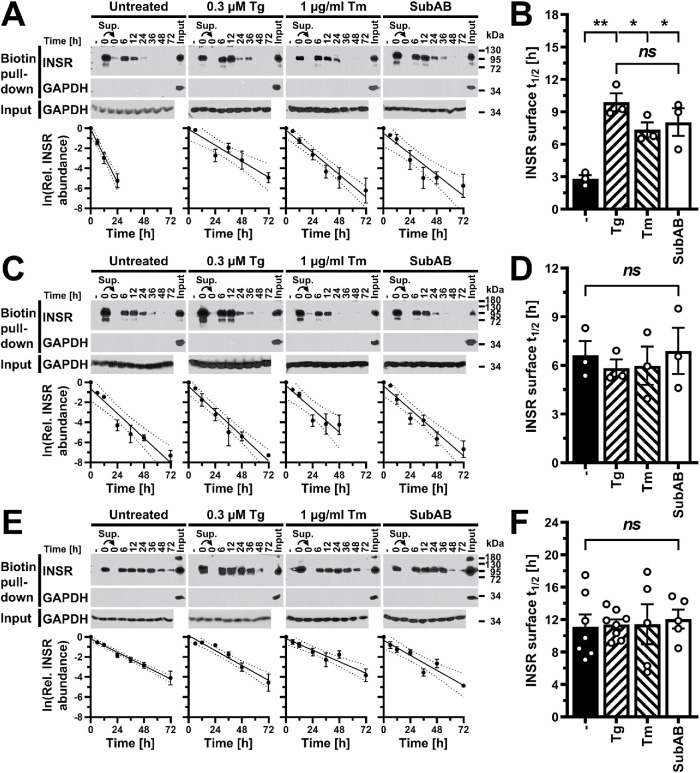
FIGURE 8:
ER stress does not increase turnover of insulin receptors at the cell surface. (A, C, E) Pull down of cell surface proteins with streptavidin–agarose after biotinylation with the cell-impermeable biotinylation reagent sulfosuccinimidyl-6-(biotinamido)hexanoate from (A) 3T3-F442A, (C) C2C12, and (E) Hep G2 cells. Cell extracts were prepared 0–72 h after labeling of cell surface proteins. Biotinylated proteins were isolated with streptavidin–agarose, separated by SDS–PAGE, and Western blotted for the insulin receptor and GAPDH. “–” refers to a pull-down reaction with unlabeled cell lysates. The arrows indicate that the supernatant of the pull-down reaction with the labeled 0 h sample was subjected to a second pull down with streptavidin–agarose. The lanes labeled “Input” serve as a positive control for the GAPDH Western blots on precipitates of the streptavidin–agarose pull-down reactions and themselves were not subjected to pull down with streptavidin–agarose. The rows labeled “Input” show Western blots for GAPDH on equal amounts of input protein for the streptavidin–agarose pull-down assays. The graphs show plots of the natural logarithm of the abundance of biotinylated insulin receptors over time, the line of linear regression (uninterrupted line), and the 95% confidence interval of the line of linear regression (dotted lines). (B, D, F) Comparison of the half-life, t1/2, of the insulin receptor at the cell surface of (B) 3T3-F442A (n = 3), (D) C2C12 (n = 3), and (F) Hep G2 (untreated n = 7, 0.3 μM thapsigargin n = 8, and 1 μg/ml tunicamycin and SubAB n = 5) cells. Half-lives were calculated from the slopes of linear regression lines obtained from plots of the natural logarithm of the abundance of biotinylated insulin receptors over time. Bars represent SEs. p values were calculated by ordinary one-way ANOVA with Tukey’s multiple comparisons test.

