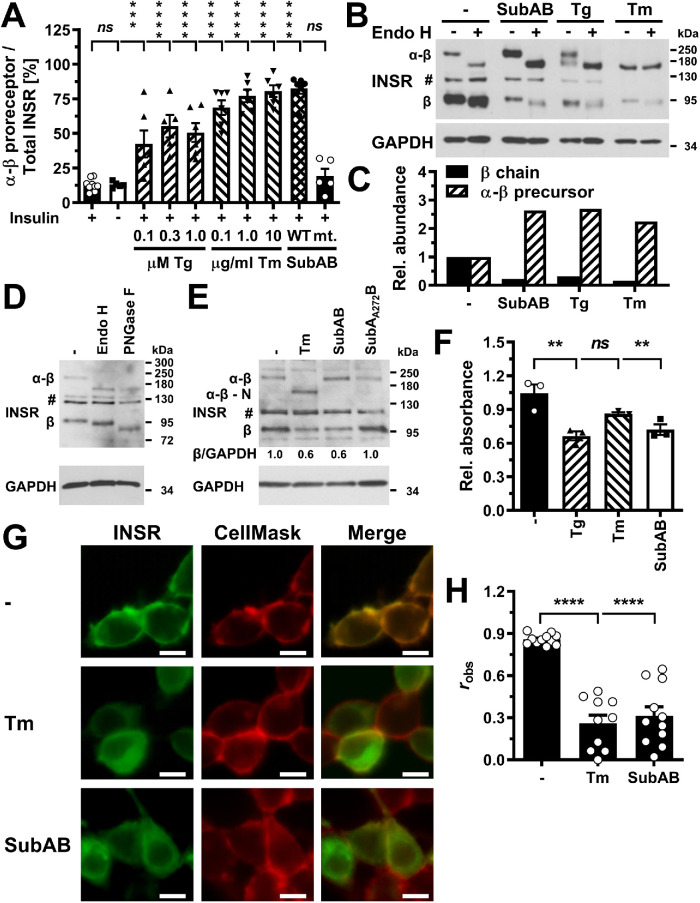
FIGURE 9:
Unprocessed α-β proreceptors accumulate in the ER of ER-stressed cells. (A) Quantification of the relative abundance of α-β precursors of the insulin receptor in C2C12 cells exposed to the indicated concentrations of thapsigargin, tunicamycin, 1 μg/ml SubAB, or 1 μg/ml SubAA272B for 24 h. Bars represent SEs (n = 12 for unstressed, insulin-stimulated cells, n = 5 for the samples treated with 0.3 μM thapsigargin and SubAA272B, and n = 6 for all other samples). p values for comparison of ER-stressed samples and samples not stimulated with 100 nM insulin to the sample stimulated with 100 nM insulin were calculated using ordinary two-way ANOVA with Dunnett’s multiple comparisons test including data for 12 h (n = 8 for unstressed, insulin-stimulated cells, n = 4 for all other samples) and 18 h (n = 10 for unstressed, insulin-stimulated cells, n = 5 for all other samples) time points. (B) Endo H digest of cell lysates prepared from C2C12 cells exposed to 1 μg/ml SubAB, 0.3 μM thapsigargin, or 1 μg/ml tunicamycin. (C) Quantification of the relative abundance of β chains and α-β proreceptors from panel B. (D) The mature β chain of the insulin receptor carries Endo H–sensitive N-linked oligosaccharides. Endo H and PNGase F digests of unstressed C2C12 cells were immunoblotted for the β chain of the insulin receptor. “#” indicates an unspecific band. (E) Steady-state insulin receptor levels in untreated HEK 293 cells or HEK 293 cells treated for 18 h with 0.1 μg/ml tunicamycin, 1 μg/ml SubAB or 1 μg/ml SubAA272B. (F) MTT activity of untreated HEK 293 cells and HEK 293 cells exposed for 18 h to 300 nM thapsigargin, 1 μg/ml tunicamycin, or 1 μg/ml SubAB. Bars represent SEs (n = 3). p values for comparison of treated samples to the untreated sample were calculated by ordinary one-way ANOVA with Dunnett’s multiple comparisons test. (G) Localization of GFP-tagged insulin receptors in transiently transfected HEK 293 cells after 18 h treatment with 1 μg/ml tunicamycin or 1 μg/ml SubAB. Scale bar = 10 μm. (H) Average Pearson’s correlation coefficient robs between the GFP-tagged insulin receptor and CellMask Deep Red fluorescence determined from 11 randomly chosen cells. Bars represent SEs (n = 10 for tunicamycin-treated samples and n = 11 for all other samples). p values for comparison of the treated to the untreated samples were calculated with an ordinary two-way ANOVA using Tukey’s multiple comparisons test on arcsine-transformed data. The Pearson correlation coefficients for the randomized images are –0.13 ± 0.08, –0.13 ± 0.07, and –0.33 ± 0.07 for the untreated, tunicamycin-treated, and SubAB-treated cells and are significantly different (p < 0.001, calculated with a two-way ANOVA using Šidák’s correction for multiple comparisons [ Šidák, 1967] on arcsine-transformed data) from the corresponding Pearson correlation coefficients for the nonrandomized images.

