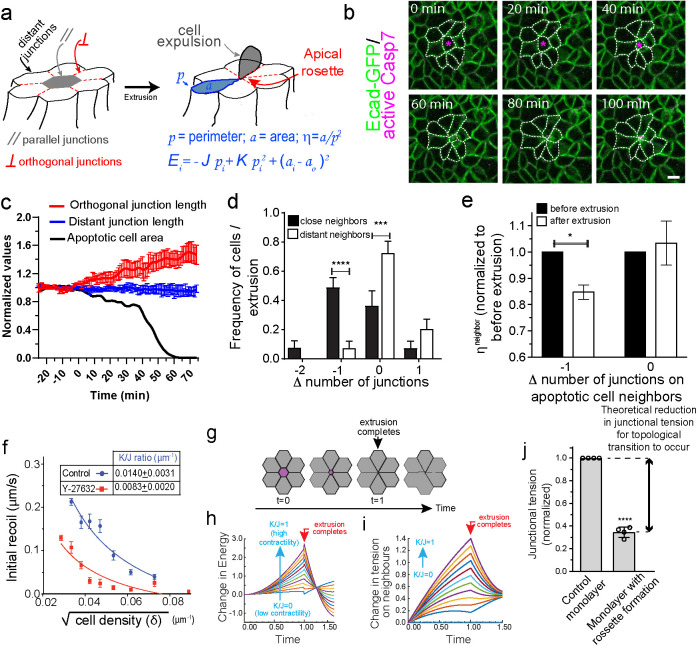
FIGURE 1:
Apoptotic rosettes involve local changes in neighbor cell topology that are constrained by the mechanical regime of the epithelium. (a) Cartoon representation of the phenomenon of apoptotic cell extrusion. In gray is depicted the apoptotic cell, whereas in white are the surrounding cell neighbors. Distant, parallel, and orthogonal sets of junction are indicated as well as cell (area α and perimeter p) and model parameters (cell–cell adhesion J, junctional spring constant K, cell resting area α0, and energy E). (b) Still images of E-cad-GFP MCF-7 cell monolayers treated with etoposide showing an event of apoptotic cell extrusion and rosette formation. (c) Analysis of orthogonal junction and distant junction length as well as apoptotic cell area for the images shown in b (see also Supplemental Movie S1). Time = 0 was defined as the time when apoptotic cell area start to reduce (t = 20 min in images in b). Data are mean ± SEM for n = 8 junctions per group of junctions. (d) Frequency distribution of Δ number of junctions = number of junctions after extrusion-number of junctions before extrusion for cells that surrounds apoptotic cells. Data are the means ± SEM of five extrusion events (eight cells per extrusion event, n = 5, ****p < 0.0001; ***p < 0.001; two-way ANOVA Sidak’s multiple comparisons test). (e)  measured before and after extrusion for cells experiencing or not a reduction (–1) in their number of sides. Cell neighbors. Data are the mean of five extrusion events (*p < 0.05, two-way ANOVA Sidak’s multiple comparisons test. (f) Nonlinear regression analysis of junctional tension measurements on cells at different cell density. Results show
  ratio values obtained as described in Section 5 of the Computational Supplement. (g) Time series sequence of the process of extrusion analyzed using a vertex model. (h and i) Analysis of monolayer energy (h) and junctional tension (i) on cell neighbors during extrusion in the model. Extrusion and rosette formation complete at time = 1. Calculations were performed for different values of
  . (j) Theoretical predictions of the amount of junctional softening (reduction in
  ratio) that is required for control monolayers (
 = 0.01401 ± 0.00314 μm–1 ) for topological cell changes to occur. Values are means ± SD of calculations using cell parameters (changes in area and η observed in four independent extrusion events, ****p < 0.0001; two-tailed paired t test). Scale bars, 20 µm.

