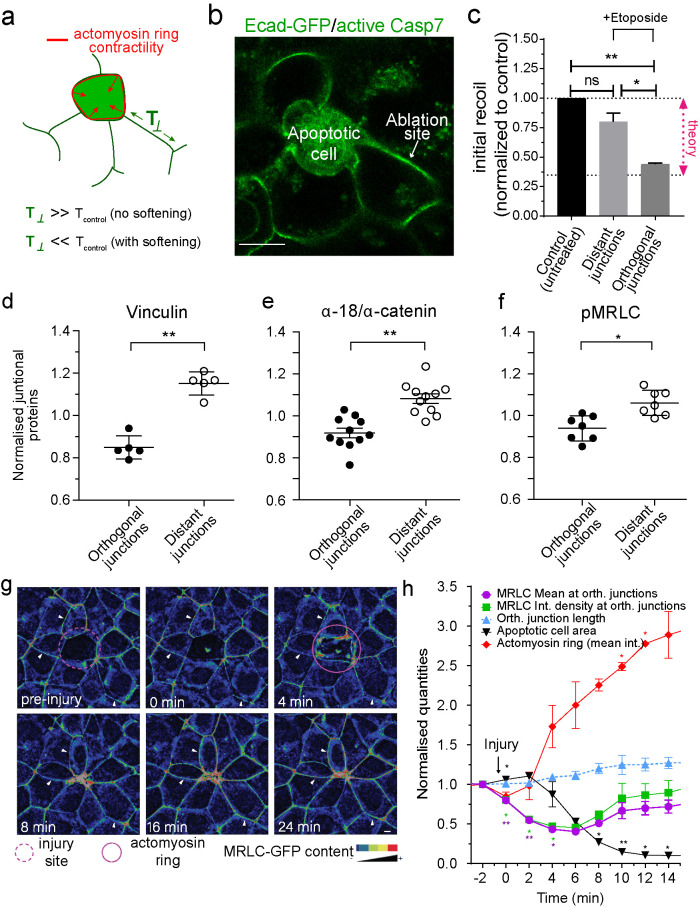
FIGURE 2:
Junctional tension is reduced in the neighborhood of apoptotic cells. (a) Schematic representation of changes in junctional tension on orthogonal junctions in response to an increase in contractility of the apoptotic actomyosin purse string in the presence or absence of active softening on the orthogonal junction itself. (b) Example of the conditions used to measure junctional tension in the neighborhood of apoptotic cells. Apoptotic cells were identified by labeling with CellEvent Caspase-3/7 Green Detection Reagent, a dye that fluoresces green in the cytoplasm of apoptotic cells. (c) Junctional tension measurements (expressed as initial recoil) in untreated monolayers and 4 h etoposide-treated monolayers, where tension was measured on distant and orthogonal junctions. Data are mean ± SEM, n = 3 independent experiments, at least 15 junctions per experiment per condition. *p < 0.05, **p < 0.01. One-way ANOVA, Tukey’s multiple comparisons test; “theory” indicates the value of junctional tension for control/untreated monolayers to experience topological transitions without increasing monolayer mechanical stress (see Section 6 of the Computational Supplement). (d–f) Average staining of Vinculin (d), ratio α-18/α-catenin (e), and pMRLC (f) in the junctions between the neighbors of apoptotic cells (distant and orthogonal as defined in Figure 1a). Values corresponded to measurements on individual and independent extrusion events and are normalized by the average staining across all the junctions for an event (i.e., Orthogonal + Distant). Data are means ± SEM, n > 5 extrusion events, at least 5 junctions per extrusion event per condition. *p < 0.05, **p < 0.01; two-tailed paired t test. (g and h) Analysis of junctional MRLC content in response to laser-mediated cell injury. At time = 0 min, a cell in the center (red circle) was irradiated with a multiphoton laser as described in Materials and Methods. Images were taken at 30-s intervals and the area of the injured cell and the MRLC content in parallel (mean fluorescence intensity) and orthogonal (mean fluorescence intensity and integrated fluorescence intensity) junctions were measured. Still images of time sequence with rainbow pseudocolor (g) and quantitation (h) are shown. In h, data are mean ± SEM for n = 3 movies. *p < 0.05, **p < 0.001; two-way ANOVA Dunnet’s multiple comparisons test. Scale bars, 20 µm.

