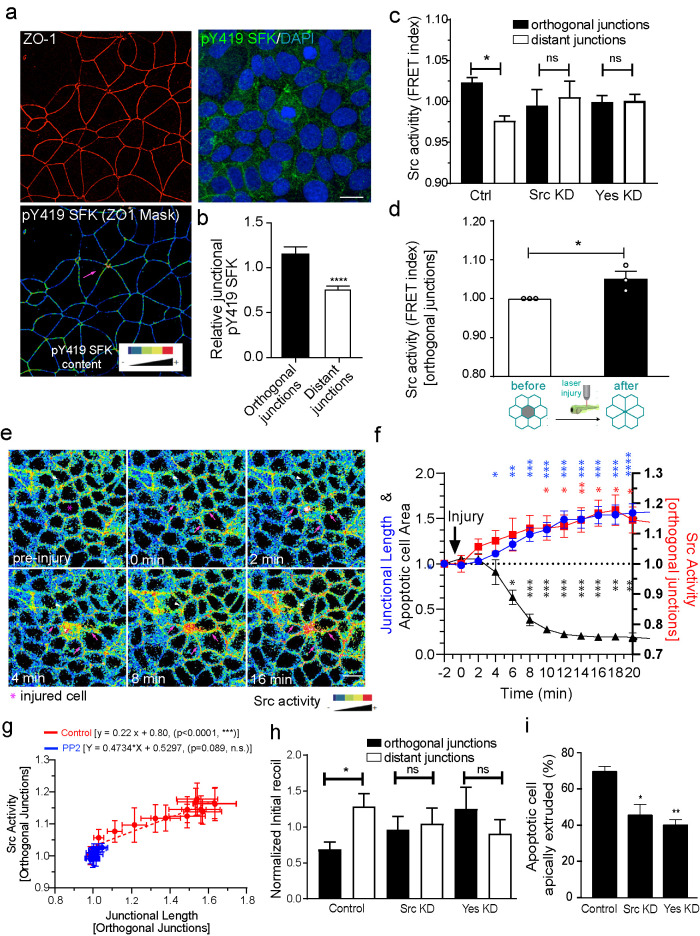
FIGURE 3:
Junctional relaxation in the neighborhood of apoptotic cells is mediated by SFK signaling. (a and b) Average staining of pY419 SFK and (c) Src Biosensor FRET activity (measured as FRET index = YFP/FRET ratio) on apoptotic neighbor cell junctions (distant and orthogonal). Apoptosis was stimulated by etoposide treatment and measurements were made on nonextruding apoptotic cells after 4 h etoposide treatment. Values corresponded to measurements on independent extrusion events and are normalized by the average FRET index across all the junctions for an event (i.e., orthogonal + distant). Data are mean ± SEM, n = 9 (b) and n > 7 (c) extrusion events per condition, at least 5 junctions per extrusion event per condition were analyzed. (b) ***p < 0.001, two-tailed paired t test and (c) *p < 0.05, one-way ANOVA with Tukey’s multiple comparisons test. (d) Analysis of junctional Src-Bio-tK FRET index after laser-mediated injury in the zebrafish periderm (see also Supplemental Movie S4). Average values of FRET index before and after injury (before rosette formation is complete) were measured. Values are mean ± SEM, n > 3 experiments (one embryo per experiment). *p < 0.05, two-tailed paired t test. (e) Analysis of junctional Src-Bio-tK FRET index and junctional length on orthogonal junctions as well as apoptotic cell area in MCF-7 cells in response to laser-mediated cell injury. At time = 0 min, cells in the center (red circle) were irradiated with a multiphoton laser as described in Materials and Methods. Then, images were taken evert 30 s and the area of the injured cell, FRET index, and junctional length in orthogonal junctions were measured. All values were normalized to the observed value observed immediately before injury (t = -2). Still images of time sequence with rainbow pseudocolor (e) and quantitation (f) are shown. Data are mean ± SEM for n = 4 movies (*p < 0.05, **p < 0.001, ***p < 0.0001, two-way ANOVA Dunnet’s multiple comparisons test). g) Plot of Src activity and junctional length for orthogonal junctions for all time points after injury in control (values derived from those in panel f and PP2-treated cell monolayers. Data are mean ± SEM for n = 3 movies. Also shown are the linear regression results for both conditions (p values correspond to statistical F test of whether the regression results were significant different from the null hypothesis of no correlation between both variables [i.e., slope = 0]). (h) Junctional tension measurements (expressed as initial recoil) in control siRNA, Src siRNA (Src KD), and Yes siRNA (Yes KD) Ecad-GFP MCF-7 cells. Initial recoil was measured on distant and orthogonal junctions around apoptotic cells which has not completely extruded (∼50% of monolayer cell area average). Monolayers were treated with Etoposide as described in Materials and Methods. Data are mean ± SEM for n = 8–10 extrusion events per condition. *p < 0.05; one-way ANOVA, Tukey’s multiple comparisons test. (i) Frequency of apoptotic cell extrusion in etoposide-treated E-cad-GFP MCF-7 monolayers that were treated with Control siRNA, Src siRNA (Src KD), and Yes siRNA (Yes KD). Ecad-GFP MCF-7 monolayers were treated for 4 h before fixation and apoptotic cells were identified using an anti-cleaved caspase 3 antibody. Data are mean ± SEM for n = 3 independent experiments. *p < 0.05; **p < 0.01; one-way ANOVA, Tukey’s multiple comparisons test. Scale bars, 20 µm.

