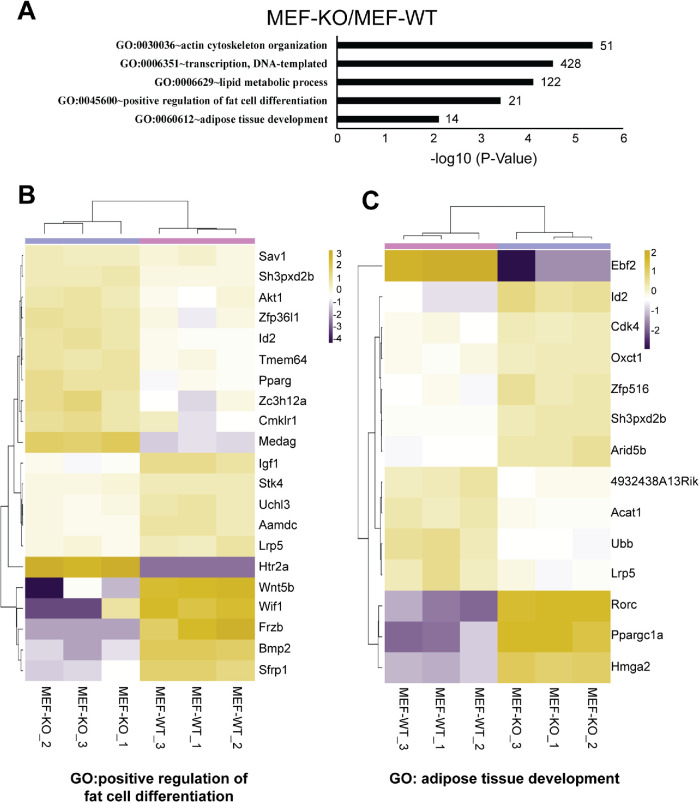
FIGURE 1:
Sets of adipocyte-related genes are differentially expressed between wild-type (MEF-WT) and β-knockout (MEF-KO) mouse embryonic fibroblasts. (A) Gene ontology on MEF-KO/MEF-WT pairwise comparison reveals enrichment of genes involved in adipose or fat development, actin cytoskeleton, and transcriptional mechanisms. GO enrichment terms are based on significance of p-value < 0.05 (normalized to -log10) cutoff. Numbers at the end of each bar reflect the numbers of genes identified in each GO-term. (B, C) Metric heat-map clustering of expression levels of genes associated with GO term: positive regulation of fat cell differentiation (GO:0045600) and adipose tissue development (GO:0060612). Genes are selected when they are differentially expressed by at least twofold in WT vs. KO comparisons. Clustering is based on the center values (CVs) of mean gene expression levels. Scale bar: log2 CPM. Data presented are based on three biological replicates (n = 3). See Materials and Methods for full description.

