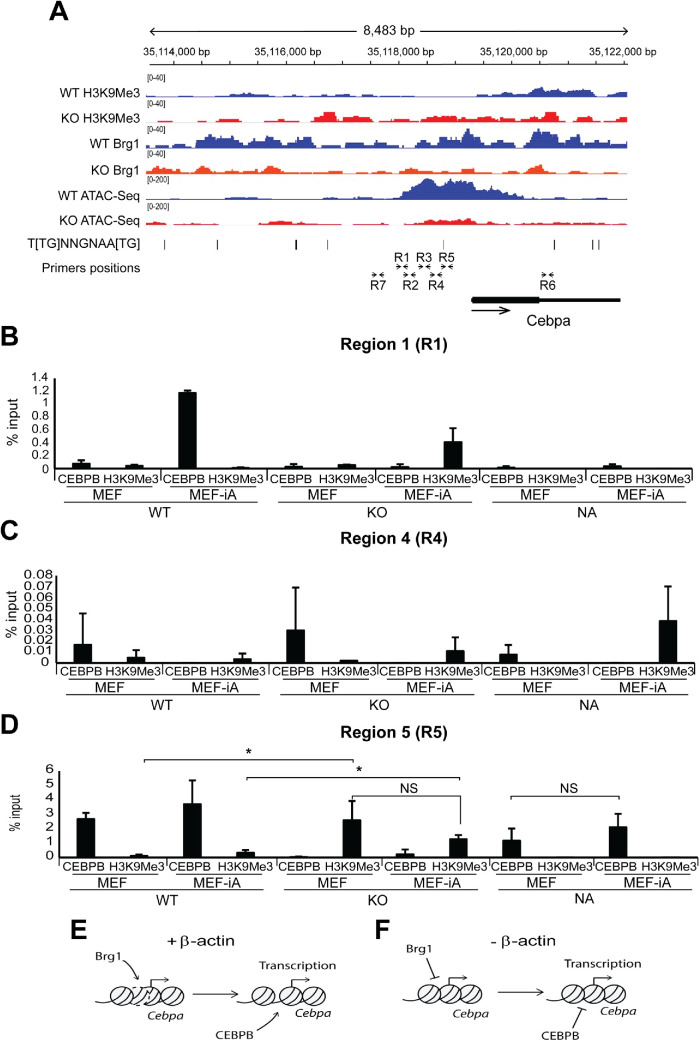
FIGURE 4:
β-actin KO cells show actin-dependent loss of chromatin accessibility around the TSS and upstream regulatory region of Cebpa, which impairs CEBPB binding for transcription activation. (A) ChIP-Seq profiles of H3K9Me3, H3K27Me3, Brg1, and ATAC-Seq profiles of WT and KO cells around the Cebpa gene. The y-axis data range represents RPKM (reads per kilobase of sequence range per million mapped reads) per bin. The y-axis of tracks in the same image were set to the same range. Gene body position (exon: box, intron: line), CEBPB consensus binding motif 5′-T[TG]NNGNAA[TG]-3′ (UniProtKB - P28033), and positions of the primers for qPCR analysis described in panel B are shown below the tracks. ChIP-Seq profile data for each assay are presented as individual points consisting of two biologically independent replicates (n = 2). (B–D) Results from ChIP experiments with antibodies against CEBPB and H3K9Me3 and qPCR analysis with primers across the Cebpa gene regulatory region (R1–R5) and control regions further upstream (R7) and inside the gene (R6) show that CEBPB binding is impaired at regions of decreased chromatin accessibility during adipogenesis. See A for the locations of the R1–R7 regions amplified by qPCR. The analysis was normalized against % input (n = 3; *p-value < 0.05, **p-value < 0.01). See Supplemental Figure S2 for ChIP qPCR analysis across regions R2, R3, R6, and R7. CV for all three replicates are presented as mean value with error bars representing SD. Significance t tests were performed based on a one-tailed hypothesis (p-values). (E, F) A speculative model suggesting that loss of nuclear β-actin impairs recruitment of Brg1, leading to compact chromatin with increased H3K9me3 and loss of chromatin accessibility that altogether impairs CEBPB binding required for Cebpa transcription activation.

