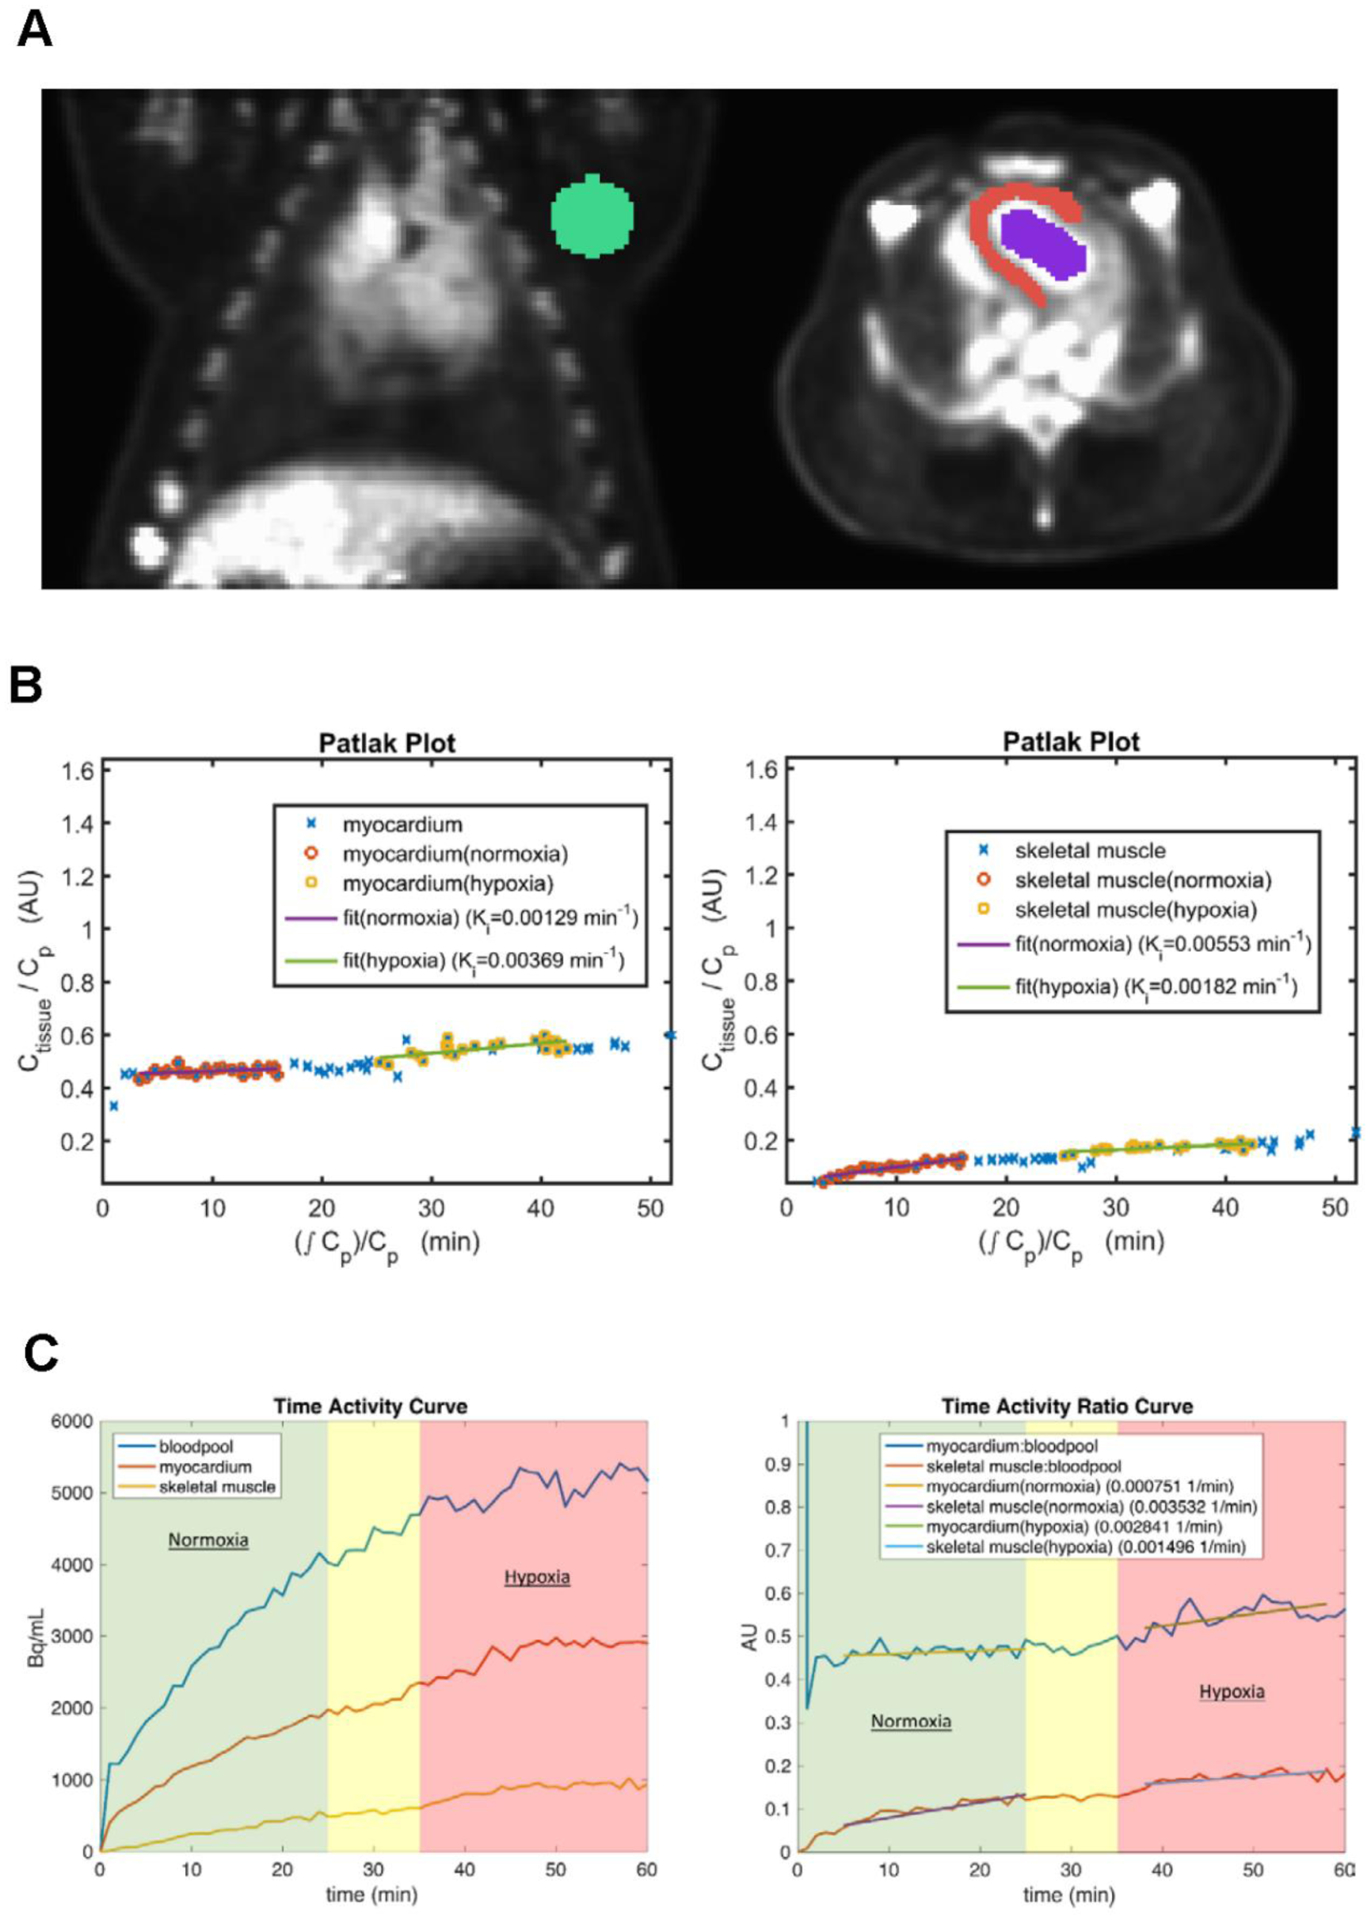
Figure 5:

(A) Representative images of the ROIs drawn for the skeletal muscle (green), myocardium (red) and bloodpool (blue). (B) Patlak plots for the myocardium (left) and skeletal muscle (right) during the rest-stress protocol. These plots show an increase in the Ki (myocardium) and a decrease in the Ki (skeletal muscle) during hypoxia. (C) Example time activity curve during 18F-FDG infusion showing time activity in the left ventricular bloodpool, left ventricle (myocardium), and skeletal muscle (left). Example time activity ratio curve (obtained by normalization to the bloodpool time activity curve) for myocardium and skeletal muscle (right). The slope of the myocardium time activity ratio during hypoxia is increased relative to normoxia and to skeletal muscle. The green background reflects time in normoxic breathing, the red background reflects time in hypoxic breathing, and the yellow background reflects time spent waiting for the hypoxic steady state (i.e., hypoxic gas administration began at 25 minutes).
