
Figure 6:
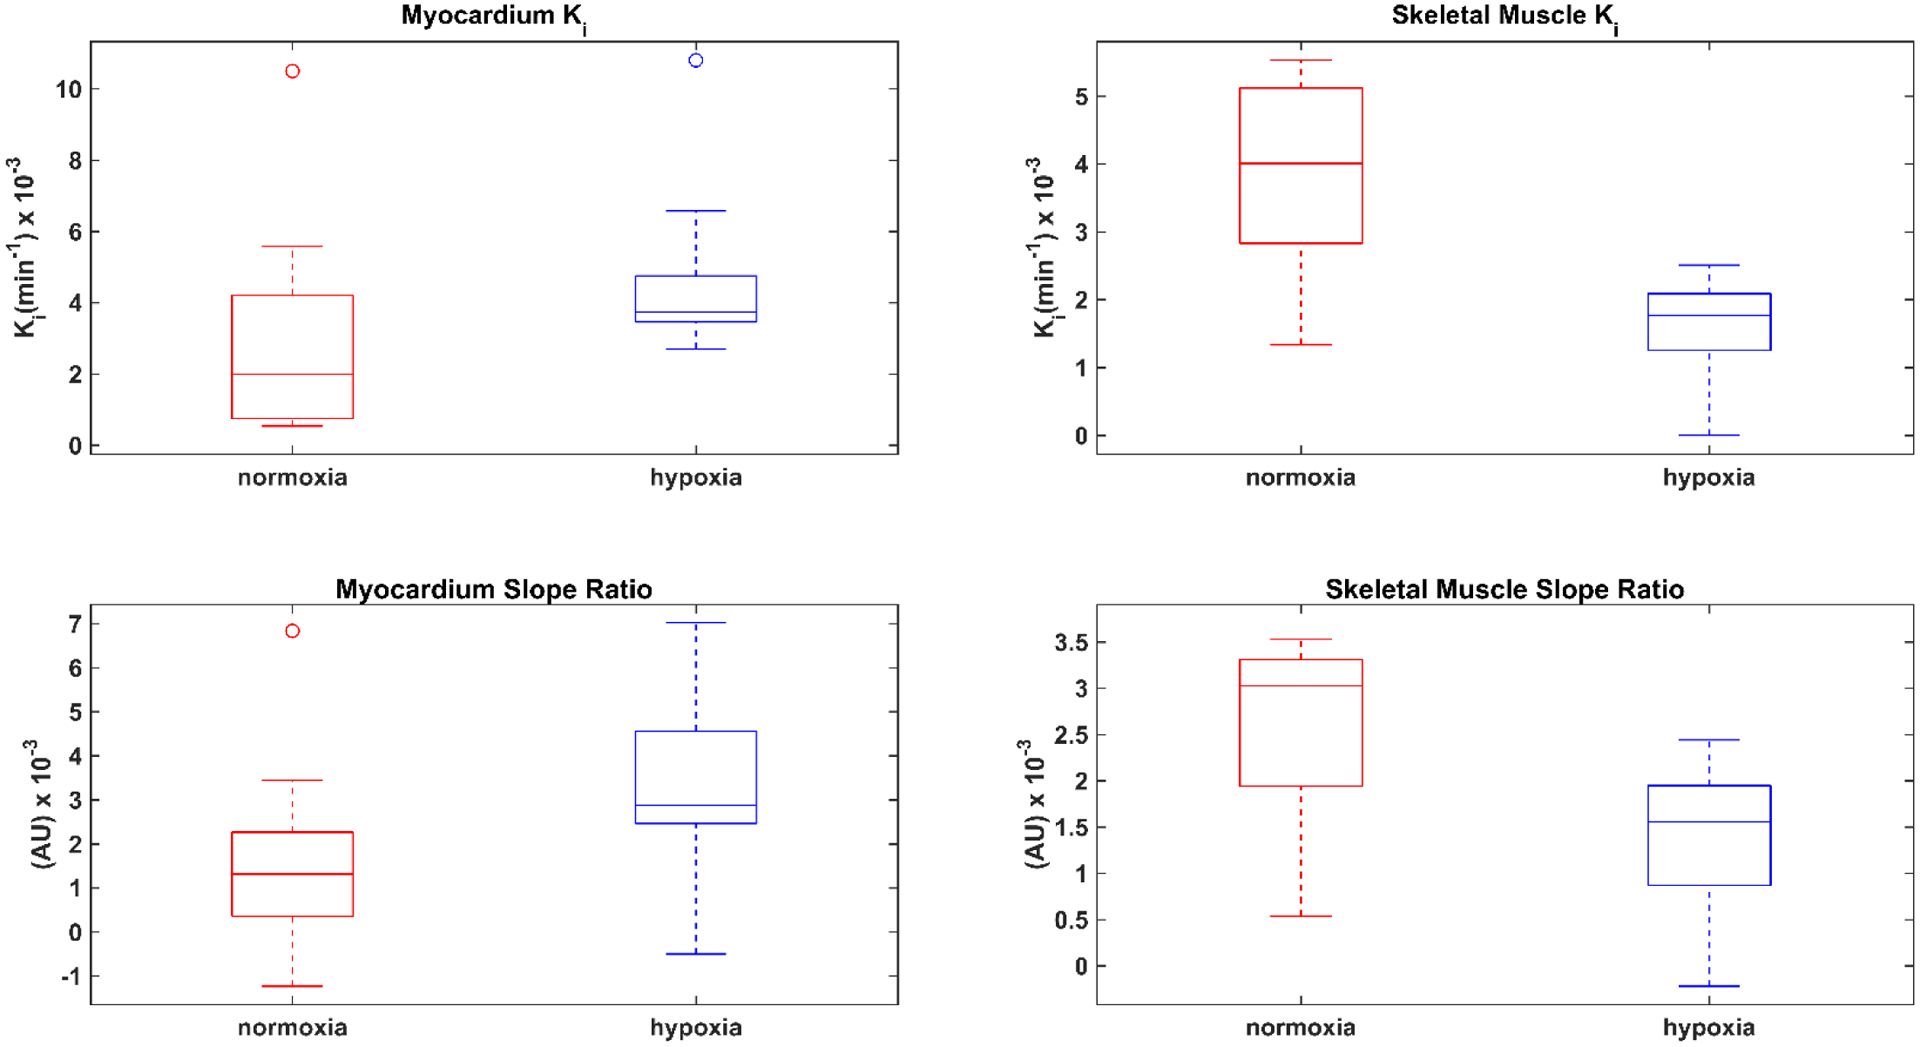
Box plots represent the median (central mark) and the edges of the box are the 25th and 75th percentiles, the whiskers extend to the most extreme data points not considered outliers, and outliers (open circles) are plotted individually in normoxia (red) and hypoxia (blue). Patlak rate constant (Ki) (top row) show a significant hypoxic-dependent increase in the myocardial uptake rate and a decrease in the skeletal muscle uptake rate. Box plots show changes that are similar in magnitude and direction as determined by the Patlak rate constant (Ki) during hypoxia in the myocardium:blood pool and skeletal muscle: blood pool slope ratios (bottom row). Refer to Table III for relevant p-values for Ki and slope ratio.