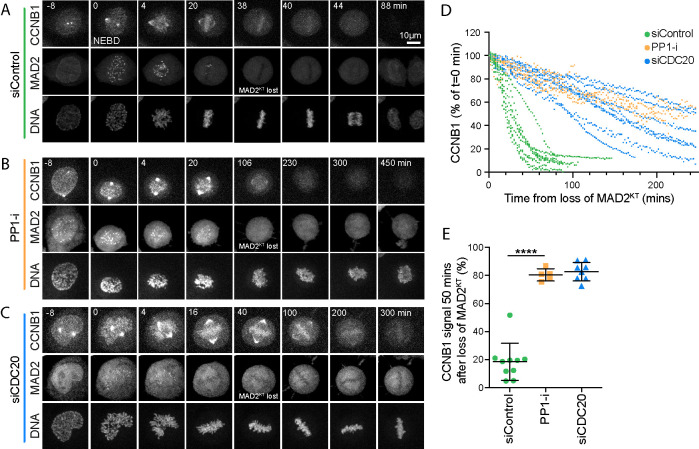
FIGURE 4:
PP1 inhibition prevents rapid cyclin B destruction downstream of the spindle checkpoint. (A–C) HeLa CCNB1-mCherry GFP-MAD2 cells treated with (A) control siRNA, (B) 5 µM PP1 inhibitor tautomycetin (PP1-i) for 30 min prior to the start of imaging, or (C) siCDC20 were imaged for 12 h at 2 min intervals. Chromosome congression was monitored using SiR-Hoechst, and checkpoint silencing was inferred from the loss of GFP-MAD2 from the kinetochore. Degradation of endogenously tagged CCNB1 indicated APC/C activation. Representative time course images are shown. (D) CCNB1 levels were measured as a function of time from the point at which the last MAD2-positive kinetochore (MAD2KT) was observed for siControl, PP1-i, and siCDC20 cells. CCNB1 levels were set to 100% at that point and plotted for single cells in the graph. (E) Scatter plots of the mean CCNB1 signal ± SD remaining at 50 min after loss of MAD2KT for siControl (n = 10), PP-i (n = 5), and siCDC20 (n = 8). *** denotes p < 0.001.

