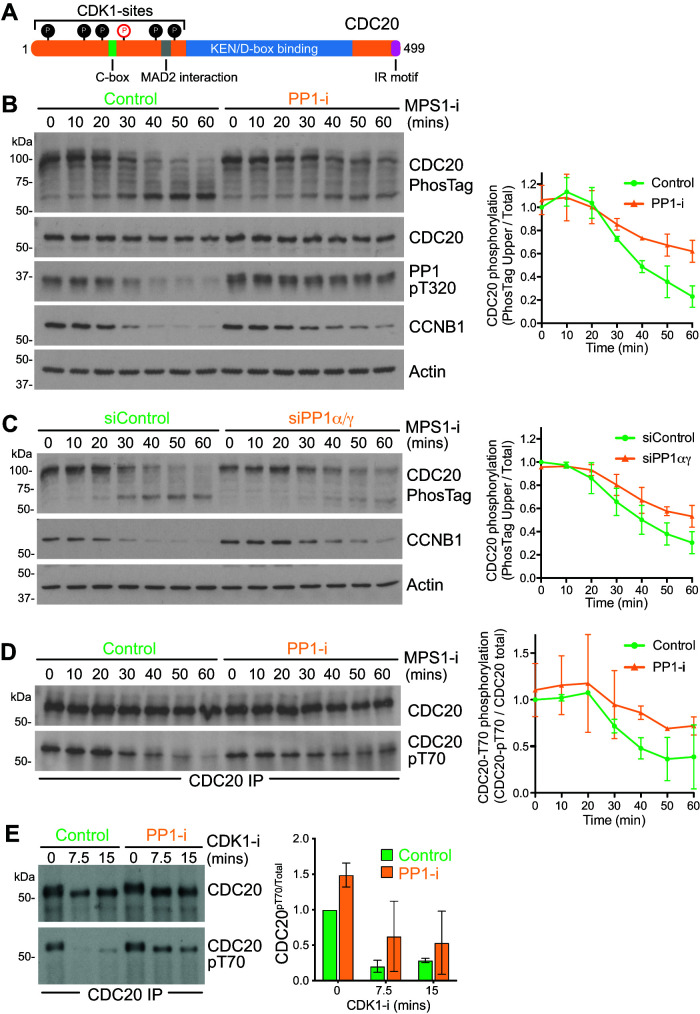
FIGURE 7:
PP1 dephosphorylates the N-terminal region of CDC20. (A) Schematic representation of CDC20 structure. Six N-terminal CDK1 sites are indicated as filled circles, and the pT70 site is marked in red in an open circle. (B) Synchronous progression of mitotic HeLa cells pretreated with DMSO or PP1 inhibitor into anaphase was triggered with MPS1 inhibitor and samples were collected every 10 min. Cell cycle progression was monitored by cyclin B1 Western blot, CDC20 phosphorylation state by PhosTag gel, and PP1 activation status by Western blot for PP1-pT320. Actin was used as a loading control. The mean level ± SD of phospho-CDC20 (top band in the PhosTag blot) relative to total CDC20 is plotted in the line graph as a function of time (n = 3). (C) Synchronous progression of control-depleted or PP1α/γ-depleted mitotic HeLa cells into anaphase was triggered with MPS1 inhibitor. The mean ± SD of phospho-CDC20 (top band in the PhosTag blot) relative to total CDC20 is plotted in the line graph (n = 3). (D) CDC20 was immunoprecipitated from synchronized cells treated with MPS1 inhibitor as in B, and samples were taken every 10 min. The immunoprecipitates were blotted for pT70-modified CDC20 and the total amount of CDC20. The mean level ± SD of pT70 relative to total CDC20 is plotted in the line graph (n = 2). (E) Synchronous progression of mitotic HeLa cells pretreated with DMSO or PP1 inhibitor into anaphase was triggered with CDK1 inhibitor, and samples were collected every 7.5 min. CDC20 was immunoprecipitated and the immunoprecipitates blotted for pT70. CDC20 pT70 levels relative to total CDC20 are plotted in the bar graphs as mean ± SD (n = 2).

