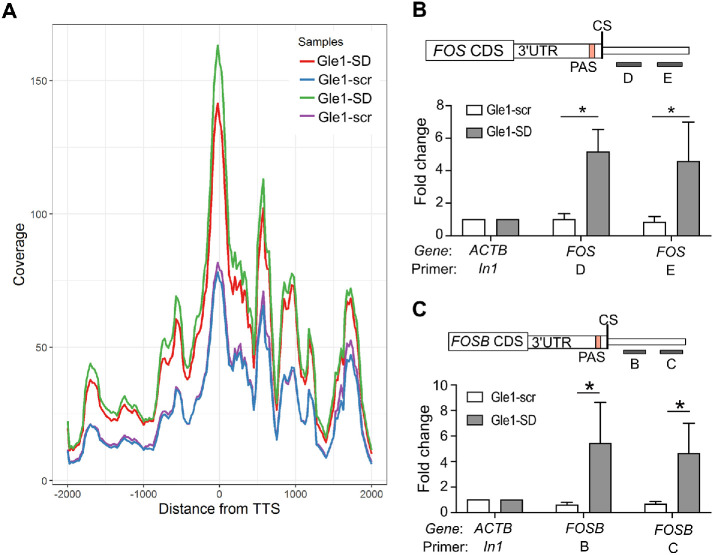
FIGURE 2:
Gle1-SD peptide treatment indicates transcription termination defect in Gle1 target genes. (A) Gene coverage around TTS ± 2 kb of all upregulated genes from RNA-seq data is shown. Duplicate data sets are depicted individually. (B) Schematic depicts the position of primers D and E downstream of the 3′UTR and cleavage site (CS) of the Fos gene. RT-qPCR data represent fold change values (mean ± SEM) from at least three biological repeats in nuclear pre-mRNA levels on Gle1-scr or Gle1-SD treatment. (C) Schematic depicts the position of primers B and C downstream of the 3′UTR and cleavage site (CS) of the FosB. Shown is fold change (mean ± SEM) in nuclear levels of pre-mRNA detected using RT-qPCR of Gle1–scr- or Gle1–SD-treated cells from at least three biological repeats. Samples (B and C) were normalized to actin (In1) values and fold change was calculated using ΔΔCT method as in Figure 1. ΔCT values were used to calculate statistical significance using one-tailed, paired t test (*p < 0.05).

