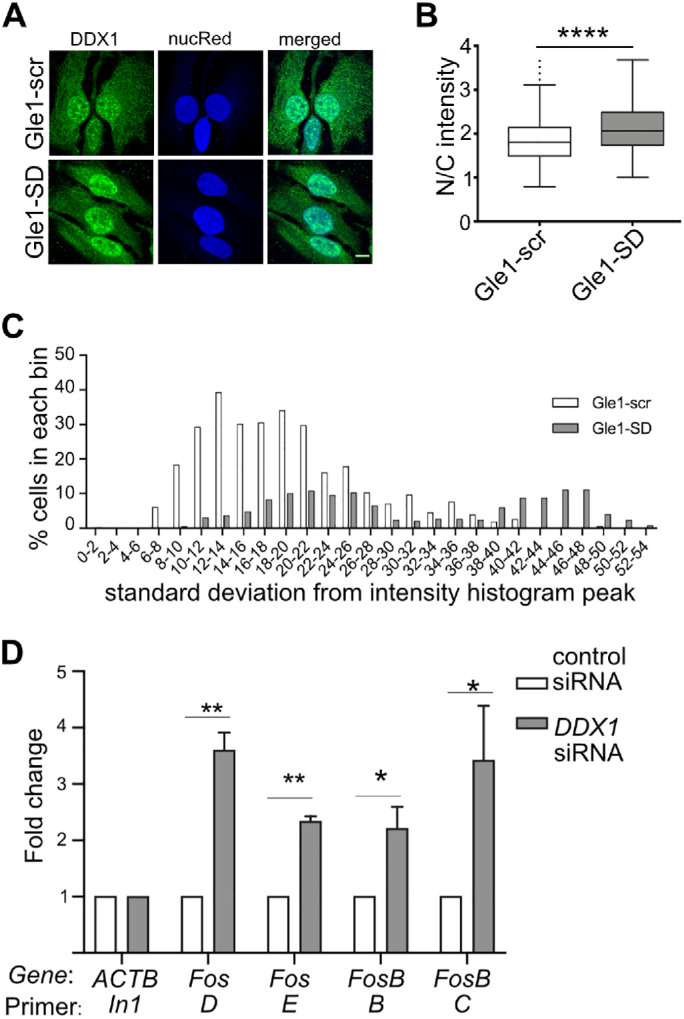
FIGURE 4:

Gle1-SD effects are mediated through DDX1. (A) Gle1-scr or Gle1-SD peptide-treated HeLa cells were immunostained with DDX1 antibody. NucRed nuclear staining is pseudocolored as blue. Maximum intensity projected images are depicted and were used for subsequent quantification. Scale bar represents 10 μm. (B) Confocal images from three independent experiments were quantified using Image J and the nuclear/cytoplasmic ratio was plotted from over 290 cells. Unpaired, two-tailed t test was used to calculate statistical significance (****p < 0.0001). (C) Intensity Variation (SD of intensity histogram) analysis was done using Nikon Elements software over the nucleus region of interest from the above images. (D) HeLa cells were transfected with control or DDX1 siRNA for 72 h. RT-qPCR from nuclear RNA shows fold change (mean ± SEM) in nuclear pre-mRNA transcripts from three independent experiments. Samples were normalized to actin (In1) and fold change was calculated using ∆∆CT method (as detailed in Figure 1). ∆CT values were used to calculate statistical significance using one-tailed, paired t test (*p < 0.05 and **p < 0.005).
