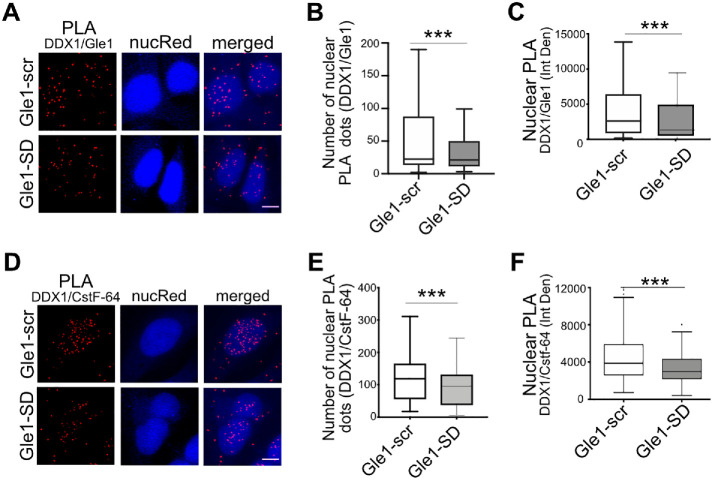
FIGURE 5:
Gle1-SD disrupts colocalization between Gle1 and DDX1. (A) Shown are maximum intensity projected confocal images detecting proximity ligation between Gle1 and DDX1 in Gle1–scr- or Gle1–SD-treated samples. Scale bar represents 5 µm. (B) Number of PLA dots in the nucleus were quantified using ImageJ from over 200 cells per condition acquired over at least three independent experiments, and unpaired, two tailed t test was used to calculate statistical significance (***p < 0.0005). (C) Nuclear intensity of PLA dots was measured as Integrated Density using ImageJ from over 200 cells per condition acquired over three independent experiments, and unpaired, two tailed t test was used to calculate statistical significance (***p < 0.0005). (D) Proximity Ligation between DDX1 and CstF-64 was detected in Gle1–scr- or Gle1–SD-treated cells. Maximum intensity projected images are depicted. Scale bar represents 5 µm. (E) Number of PLA dots in the nucleus was measured using ImageJ from over 200 cells acquired over three independent experiments. (F) Nuclear intensity of PLA dots was measured as Integrated Density using ImageJ from over 200 cells from three independent experiments. Prism was used to calculate significance using unpaired, two-tailed t test (***p < 0.0005).

