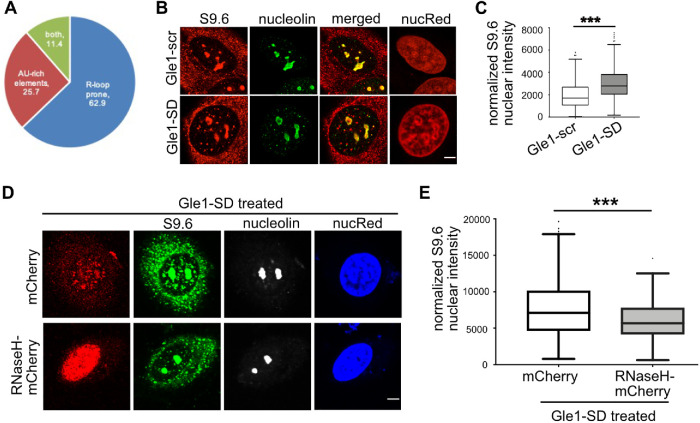
FIGURE 6:
R-loops are increased following Gle1-SD treatment. (A) Pie chart depicts bioinformatic analyses of RNA-seq target genes with >5-fold change in nuclear RNA levels. (B) HeLa cells were treated with Gle1-scr or Gle1-SD peptide, immunostained with S9.6 antibody that recognizes RNA:DNA hybrids, and co-stained with nucleolin. Representative midplane images are shown, Scale bar represents 5 µm. (C) Box and whisker plot represents the nuclear intensity (Integrated Density) of S9.6 bound from midplane sections after subtracting nucleolin intensity, as determined from three independent experiments. (D) HeLa cells were transfected with mCherry or RNaseH1-NLS-mCherry for forty hours prior to Gle1-SD treatment and immunostained as described above. Scale bar represents 5 µm. (E) Nuclear S9.6 signal from midplane section was calculated by subtracting nucleolin as above from over 130 transfected cells from three independent experiments. P value was calculated in Prism using unpaired, two-tailed t test (***p < 0.0001).

