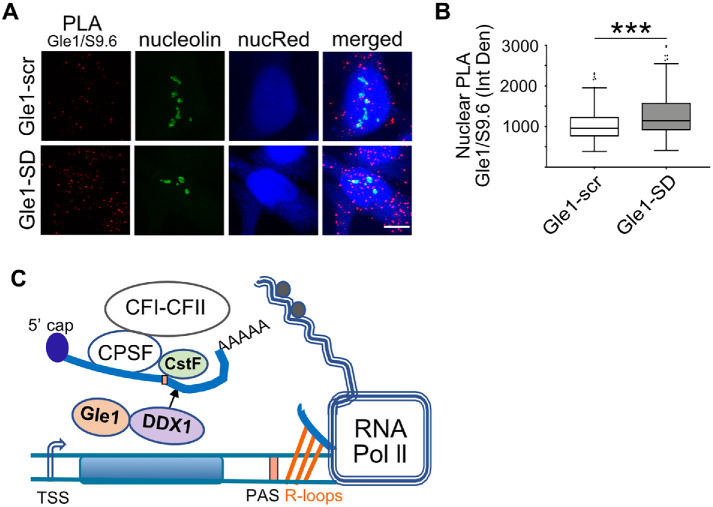
FIGURE 7:
Proximity of Gle1 to R-loops increases following Gle1-SD treatment. (A) Gle1–scr- or Gle1–SD-treated HeLa cells were subjected to PLA with Gle1 and S9.6 antibodies, counterstained with nucleolin antibody and imaged by confocal microscopy. NucRed is pseudocolored in blue. Scale bar represents 5 µm. (B) Nuclear PLA signal (in red) was quantified with nucleolin subtraction from midplane sections of over 225 cells from three independent experiments. Unpaired, two-tailed t test was used to calculate statistical significance (***p < 0.0005). (C) Model depicting a role for Gle1 in transcription termination.

