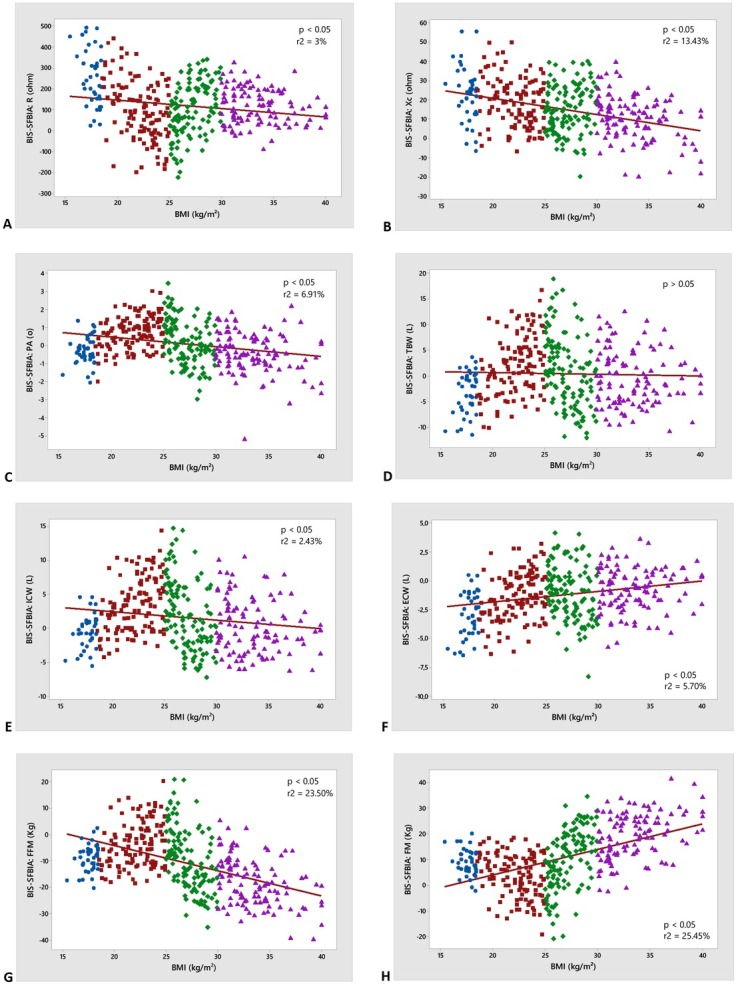
Figure 1.

Regression analyze between BIS and SFBIA bias (BIS-SFBIA) with BMI. Data analyzed only for BMI subgroups. BIS, multifrequency bioelectrical impedance spectroscopy; BMI, body mass index; ECW, extracellular water; FFM, fat free mass; FM, fat mass; ICW, intracellular water; PA, phase angle; R, resistance; SFBIA, single-frequency bioelectrical impedance; TBW, total body water; Xc, reactance. (a) R; (b) Xc; (c) PA; (d) TBW; (e) ICW; (f) ECW; (g) FFM; (h) FM. Circle: underweight; Square: normal weight; Trapezium: overweight; Triangle: obese.
