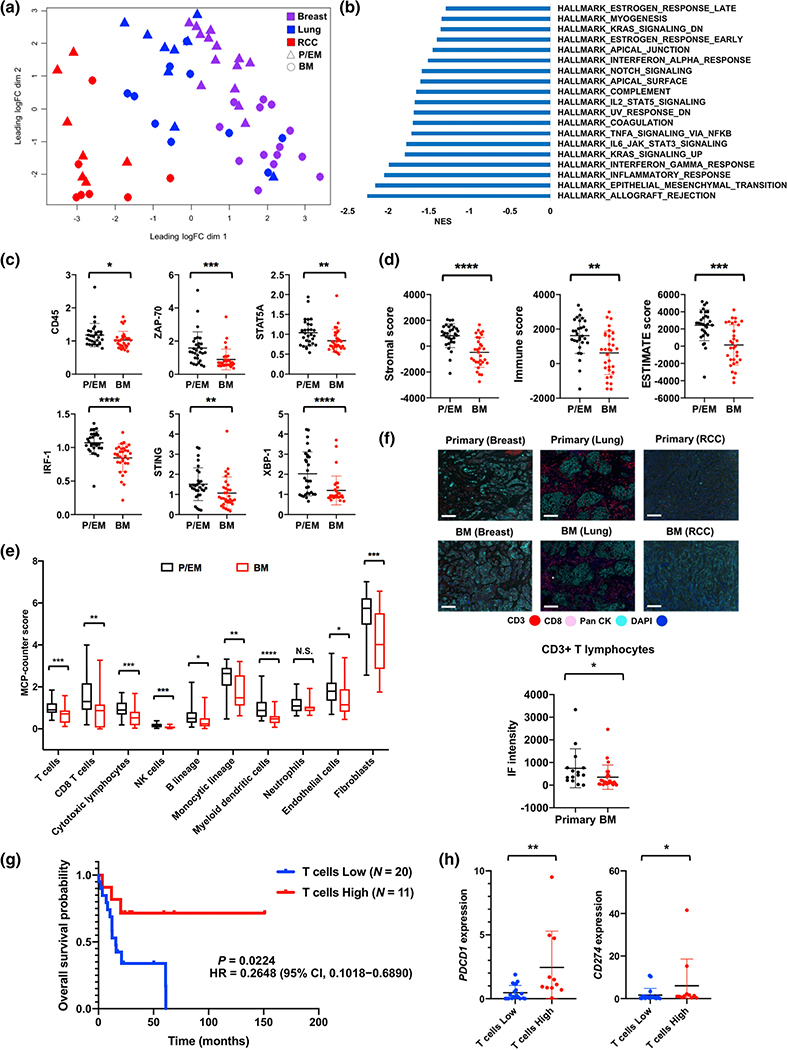
Fig. 3.
Immunosuppression in BMs shared across multiple histologies. a MDS plots of transcriptional profiles from breast (N = 14), lung (N = 9) and renal cell (N = 7) carcinomas (RCC). P/EM vs BM status and cancer types are shown with the colors and symbols. b Significantly (P < 0.05 and FDR q < 0.25) downregulated pathways by GSEA in BMs (N = 31) relative to P/EMs (N = 30). NES, normalized enrichment score. c RPPA expression of representative immune-related proteins in P/EMs (N = 30) and BMs (N = 32). d, e Transcriptional signatures of immune cells. ESTIMATE (d) and MCP-counter (e) analyses were performed for P/EMs (N = 30) and BMs (N = 31). Box and whisker plots indicate median and interquartile range (boxes), extending from minimum to maximum values (whiskers). f Representative immunofluorescence (IF) staining images (top) and quantification of CD3+ T lymphocytes (bottom) in primary tumors (N = 13) and BMs (N = 20) from breast, lung and renal cell carcinomas on the Vectra platform. Markers for CD3, CD8, pancytokeratin (Pan CK) and DAPI are shown by color as indicated. Scale bar, 100 μm. g Kaplan-Meier plots of overall survival from craniotomy for patients dichotomized by T cells status in BMs based on MCP-counter scores. P values and hazard ratios calculated by the log-rank test. h PDCD1 and CD274 expression in T cell low (N = 20) and high (N = 11) groups. c, d, f, h Horizontal bars represent mean ± SD. *P < 0.05, **P < 0.01, ***P < 0.001, ****P < 0.0001, Mann-Whitney U testing. N.S., not significant

