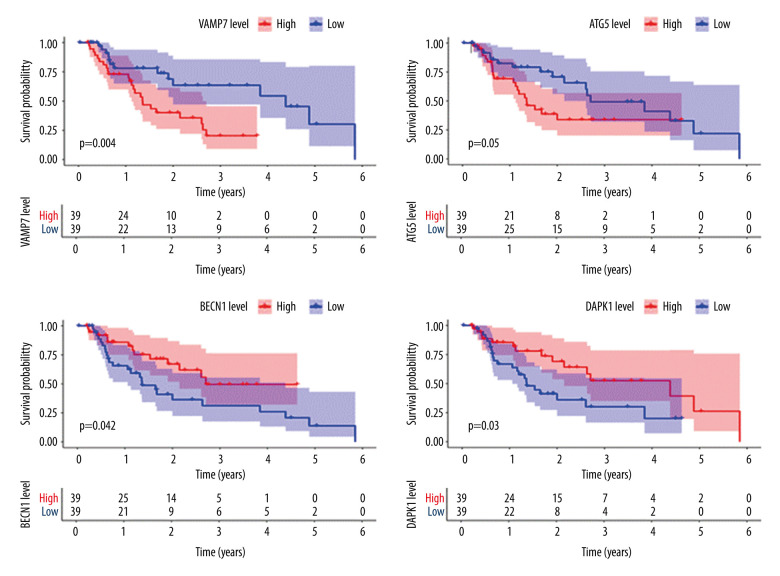
Figure 5.
Survival analysis of genes associated with prognosis in patients with esophageal adenocarcinoma, Kaplan-Meier survival curves of 4 critical genes were selected with P<0.05 as the screening criteria. The red plots represent high expression and the blue plots represent median/low expression.

