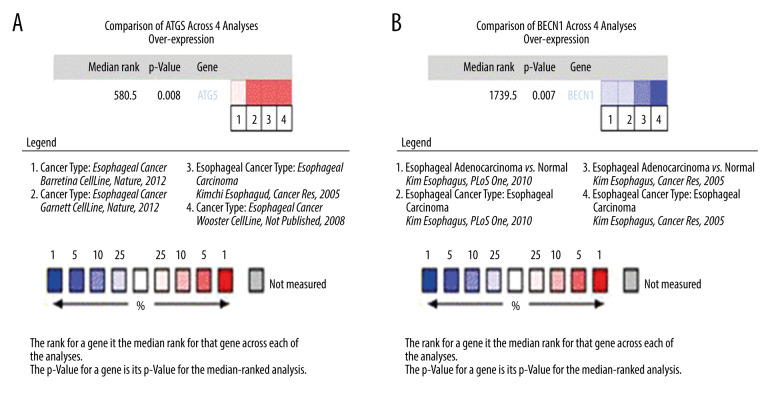
Figure 6.
Expression analysis of esophageal adenocarcinoma (EAC) adverse prognostic factors based on the Oncomine database. (A) ATG5 and (B) BECN1 expression levels in EAC. The intensity of gene expression is indexed with the color bar, and the median rank is used to demonstrate the gene rank in each analysis.

