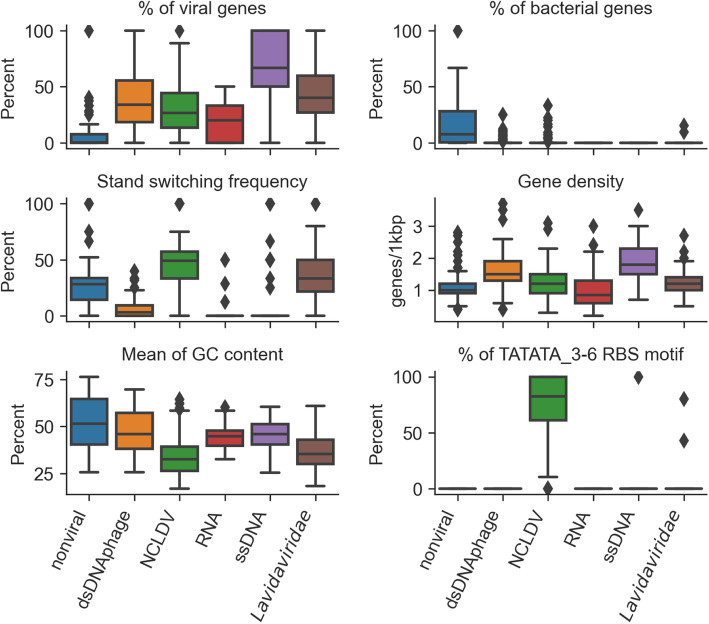
Fig. 2.
Boxplot of different features across non-viral and viral groups. “Nonviral” includes bacteria and archaea, fungi and protozoa, and plasmids. A subset of 100 random genome fragments were used for each group. “% of viral gene” is calculated as the percent of genes annotated as viral (best hit to viral HMMs) of all genes; “% of bacterial gene” is calculated as the percent of genes annotated as bacterial (best hit to bacterial HMMs) of all genes; “Strand switch frequency” is the percent of genes located on a different strand from the upstream gene (scanning from 5′ to 3′ in the + strand); “Gene density” is the average number of genes in every 1000 bp sequence (total number of genes divided by contig length and then multiplied by 1000); “Average GC content of genes” is the mean of GC content of all genes in a contig; “TATATA_3-6 motif frequency” is the percent of ribosomal binding sites (RBS) with “TATATA_3-6” motif

