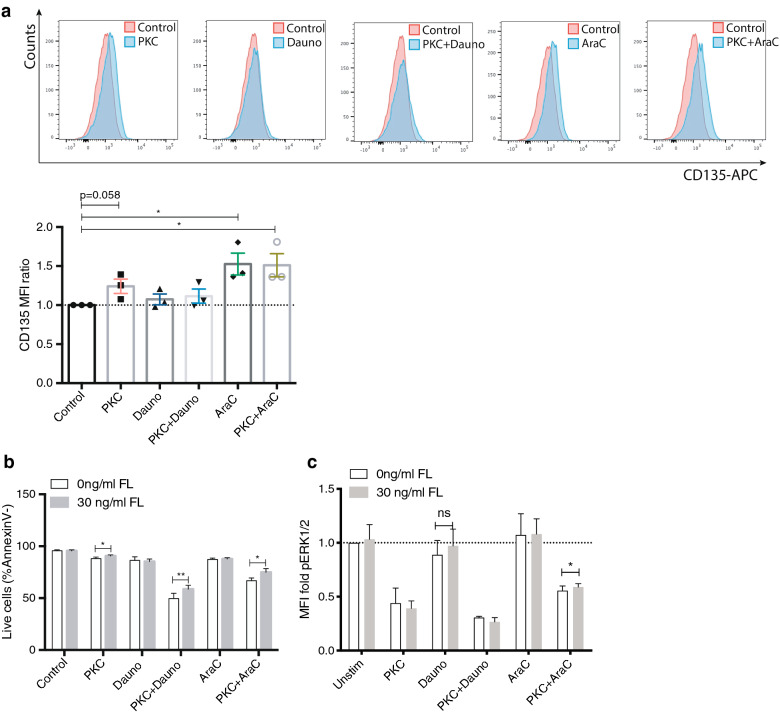
Fig. 2.
Cytarabine increase surface localization of FLT3 of MV4-11 cells. a Representative flow cytometry plots and bar graph showing the FLT3/CD135 surface expression of on MV4-11 cells after 18 h of culture with indicated treatment; PKC412 10 nM, Dauno 0.05 µM, PKC412 (10 nM) plus Dauno (0.05 µM), AraC 5 µM, PKC412 (10 nM) plus AraC 5 (µM), n = 3. b Percentage live cells (AnnexinV-) with or without FLT3 ligand (FL) after 18 h treatment, treatment as indicated; PKC412 50 nM, Dauno 0.05 µM, PKC412 (50 nM) plus Dauno (0.05 µM), AraC 5 µM, PKC412 (50 nM) plus AraC 5 µM, (n = 4) c Phospho-flow analysis of pERK1/2 expression 18 h after treatment start. Graph shown MFI fold expression compared to control (0 ng/mL FL). PKC412 50 nM, Dauno 0.05 µM, PKC412 50 nM plus Dauno 0.05 µM, AraC 5 µM, PKC412 50 nM plus AraC 5 µM. Mean ± SD (n = 3). *, P ≤ 0.05, as measured by Student’s t test

