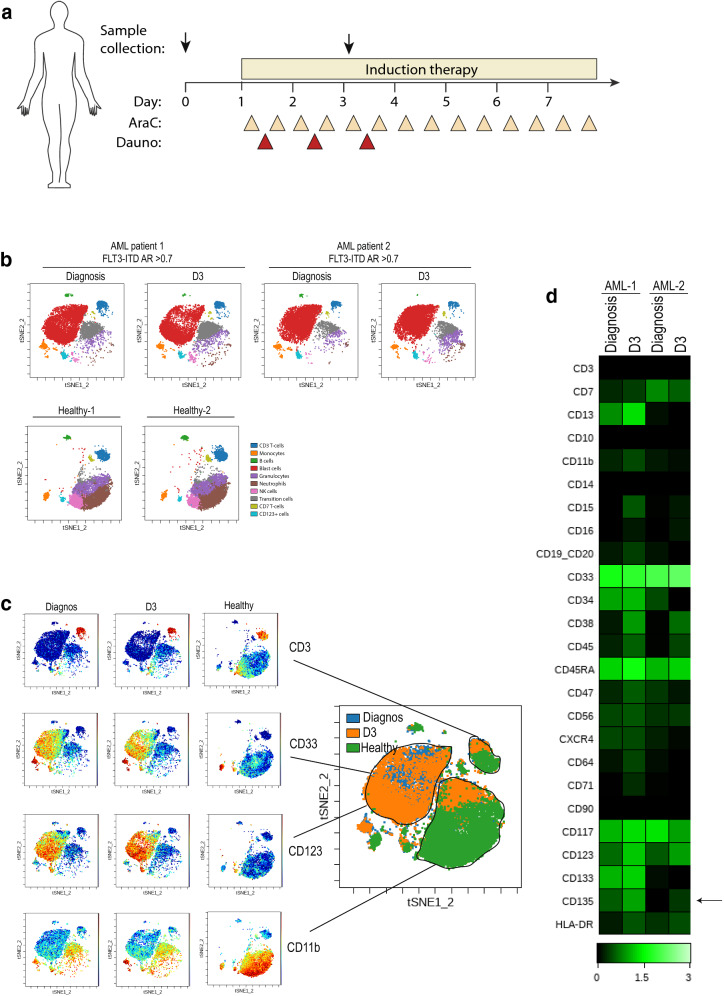
Fig. 4.
Induction chemotherapy increases FLT3 expression of AML patient cells in vivo. a Schematic of sampling strategy shown in (b). viSNE plots from time of diagnosis and day 3 of induction therapy (Dauno + AraC, 3 + 7) of AML patient-1, AML patient-2 both having FLT3-ITD allelic ratio (AR) > 0.7 and 2 healthy controls. viSNE maps manually gated cell populations based on 26 surface markers, populations as indicated in the map (blue; CD3 T-cells, orange; CD64 monocytes, green; CD19/CD20 B-cells, red; blast cells, purple; CD16 granulocytes, brown; CD15/CD16 neutrophils, pink; CD56 NK cells, grey; transition cells, yellow; CD7 T-cells, turquoise; CD123 + cells). viSNE analysis was run on 10,000 live intact single cells per sample. c Overlay of population for sample AML patient-1 at time of diagnosis and day 3 as well as healthy control overlaid to one viSNE map. d Heatmap of in vivo surface expression change during induction therapy in blast cell population, calculated transformed ratio of medians by row´s minimum using channel values (green correspond to high expression and black low). Arrow indicate FLT3/CD135 expression

