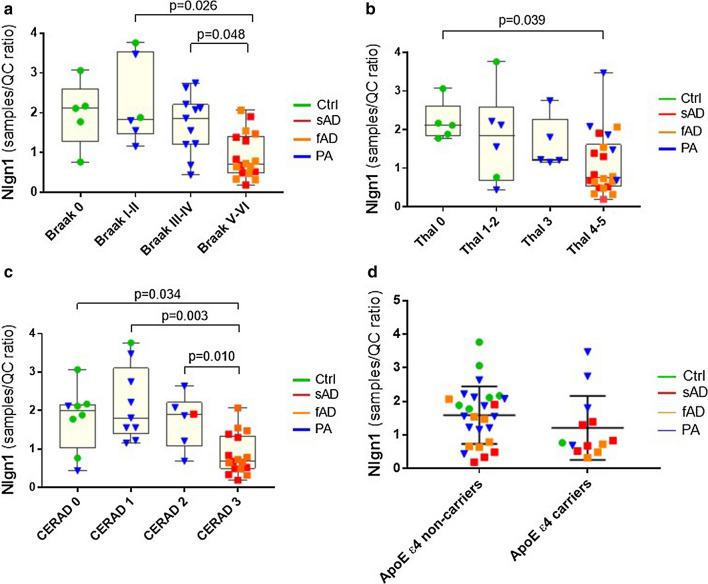
Fig. 3.
Nlgn1 level changes in relation to pathological classification. a Nlgn1 levels (as presented in Fig. 2) categorized by Braak stages (Braak 0, NFTs score 0, Braak I-II, transentorhinal; Braak III-IV, limbic; Braak V-VI, isocortical) b Nlgn1 levels classified based on Thal phases (Thal 0 = no amyloid; Thal 1–2 = isocortical; Thal 3 = basal ganglia; Thal 4 = forebrain and midbrain; Thal 5 = medulla oblongata and cerebellum). c Nlgn1 levels categorized by CERAD, neuritic plaques score (0 = none, 1 = sparse, 2 = moderate, 3 = frequent). d Nlgn1 levels categorized by ApoE allele ε4 carriers. In the box plots, median and interquartile range are represented by the box; whiskers represent the minimum and maximum values. In graph d, horizontal lines in the scatterplot represent median and interquartile range. Significance: p ≤ 0.05

