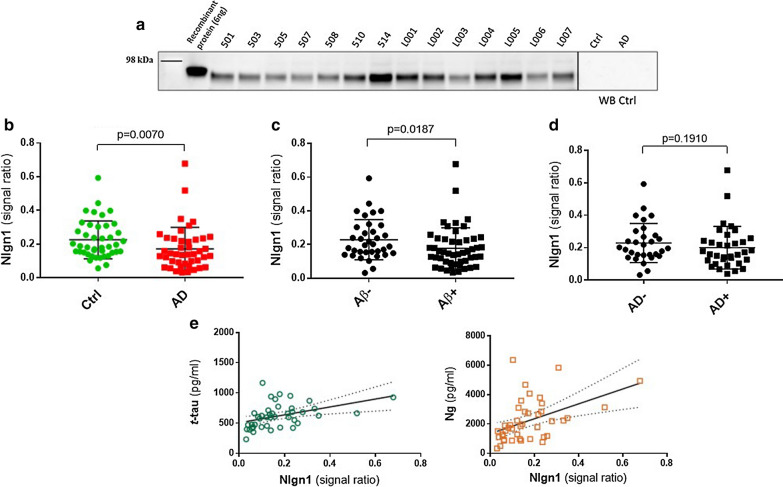
Fig. 5.
Nlgn1 levels do not differ in CSF of AD patients as compared to controls. Western blot analysis of Nlgn1 levels in CSF samples of AD (n = 43) and Ctrl (n = 42) individuals. Nlgn1 band was normalized using recombinant Nlgn1 to correct for inter-gel variation. a Representative Western blot. b Clinically characterized Ctrl and AD group c dichotomized Aβ42/40–negative (Aβ-) and Aβ42/40–positive (Aβ +) groups d AD biologically defined groups based on t-tau (cut-off = 460 pg/ml), p-tau (cut-off = 58.3 pg/ml) and Aβ42/40 (cut-off = 0.0934 pg/ml). The horizontal lines represent the median and interquartile range. Significance: p ≤ 0.05. e Correlation between CSF Nlgn1 levels and t-tau (left, Spearman´s rho = 0.547) and neurogranin (Ng) (right, Spearman´s rho = 0.512). Dashed lines represent the 95% confidence bands of the best-fit line

