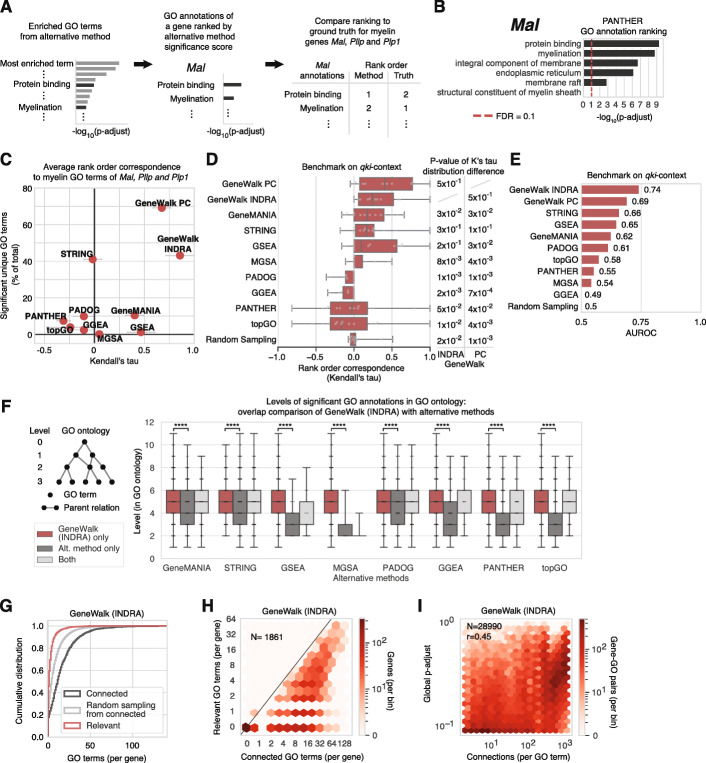
Fig. 3.
Systematic comparison of GeneWalk with alternative methods and model robustness analysis. a Schematic of systematic procedure to compare alternative methods with GeneWalk. The alternative methods (see Table 1 for brief descriptions and “Methods” section for details) are mostly based on a form of GO enrichment analysis, and result in a list of (globally) overrepresented GO terms with a significance value (p-adjust). For individual genes, such as Mal, we select the GO terms that are also direct annotations of that gene and form a GO annotation relevance rank order based on the method’s significance levels. Lastly for myelin-related genes Mal, Pllp, and Plp1, we compare the results of GeneWalk (gene p-adjust) and all other methods to the same ground truth ranking which is myelin terms shared 1st and all other annotations shared 2nd using Kendall’s tau to assess the rank order correspondence with the ground truth. b Example of GO annotation relevance ranking for Mal with the procedure outlined in (a) with alternative method PANTHER. c Results of systematic comparison outlined in (a), with average Kendall’s tau values (x-axis) over the three myelin genes. Error bars indicate standard error on the mean. The y-axis indicates the number of different unique GO annotations that are significant (for GeneWalk global p-adjust and for alternative methods p-adjust at FDR = 0.1) as a percentage of all unique GO annotation terms across all qki DE genes present in the GWN. d Distribution of Kendall’s tau rank order correspondences of predictions from GeneWalk and alternative methods (Table 1) to the ground truth benchmark of the qki-context where all gene GO annotations pairs mentioned by Darbelli et al. in [45] are jointly top-ranked and all other gene–GO annotations pairs are jointly bottom ranked. All methods are ordered by the median of their Kendall’s tau distribution, indicating their relative performances. Statistical differences between GeneWalk (INDRA or PC) and other methods are determined with the Wilcoxon signed-rank sum test. See Methods for details. e Bar chart of the area under receiver operating characteristic (AUROC) performance metric for GeneWalk and alternative methods (Table 1) on the benchmark described in (e) when considered as a binary classification task: identifying gene-function pairs as relevant or not. f Boxplots of the GO term levels of all significant (for GeneWalk global p-adjust and for alternative methods p-adjust at FDR = 0.1) gene–GO annotation pairs across all qki DE genes present in the GWN. A higher GO level reflects more specific concept information in the GO ontology [7]. Direct overlap comparison of GeneWalk (with INDRA) with the rankings from alternative methods is indicated with individual data points shown. For comparison of GeneWalk (with PC), see Additional file 1: Supplementary Fig. S1F. A Mann-Whitney U test indicates the statistical differences in median levels between levels significant for only GeneWalk as compared to only the alternative method, ****p < 10−4. g Cumulative distribution of number of connected (black) and relevant (red) GO terms per gene, alongside a simulation that uniformly randomly sampled from the number of connected terms (gray) for GWNs with INDRA. The number of relevant GO terms was smaller than with randomly sampling connections (KS test: p < 1e−16). h Hexagon density plot for all genes of interest (N = 1861) in terms of number of connected GO terms and number of relevant GO terms (at FDR = 0.1) resulting from the Qki-deficient condition GeneWalk using INDRA as a knowledge base. i Hexagon density plot of all tested gene–GO pairs (N = 28,990) as a function of GO term connectivity and similarity significance (global p-adjust, Pearson correlation r = 0.45) for the GWN described in (h)

