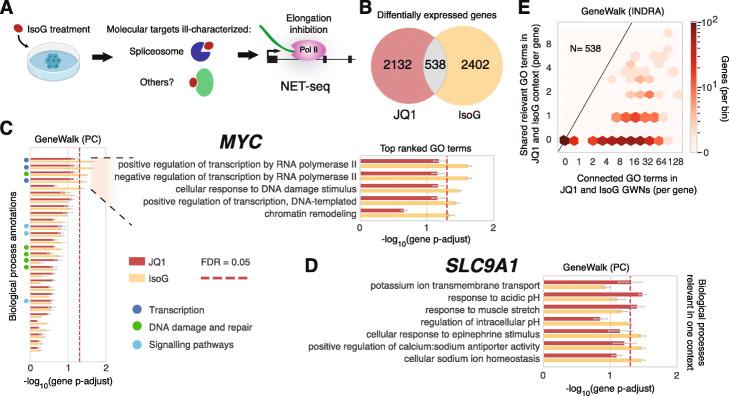
Fig. 5.
GeneWalk determines condition-specific functions through comparison of nascent transcriptome response to IsoG and JQ1 treatment. a Schematic of the experimental design in Boswell et al. [61]. NET-seq was performed on isoginkgetin (IsoG)-treated HeLa S3 cells (30 μM IsoG for 6 h, alongside DMSO controls, two biological replicates each). The in vivo molecular targets remain incompletely characterized, as IsoG treatment causes widespread Pol II elongation inhibition. b Venn diagram detailing the overlap (Fisher’s exact test: p = 0.02, odds ratio = 1.1, 95% confidence interval [1.0, 1.3]) of DE genes between JQ1 and IsoG treatments as described in Fig. 4b and S5A. c GeneWalk results (with PC as data source) for MYC in the JQ1 (red) and IsoG (yellow) condition. Annotated biological processes are rank-ordered by FDR-adjusted p value, indicating the relative functional importance of transcription (dark blue), DNA damage and repair (green), and signaling pathways (light blue) to MYC under the IsoG condition. The top five most relevant GO terms are described in the insets. See Additional file 2 for full details. Red dashed line indicates FDR = 0.05. d As in c for SLC9A1, showing the biological process terms that are relevant in either JQ1 or IsoG condition. e Hexagon density plot for overlapping DE genes (N = 538) in terms of number of overlapping relevant GO terms (FDR = 0.1) and number of possible shared connected GO terms for the GeneWalk network using INDRA as a knowledge base

