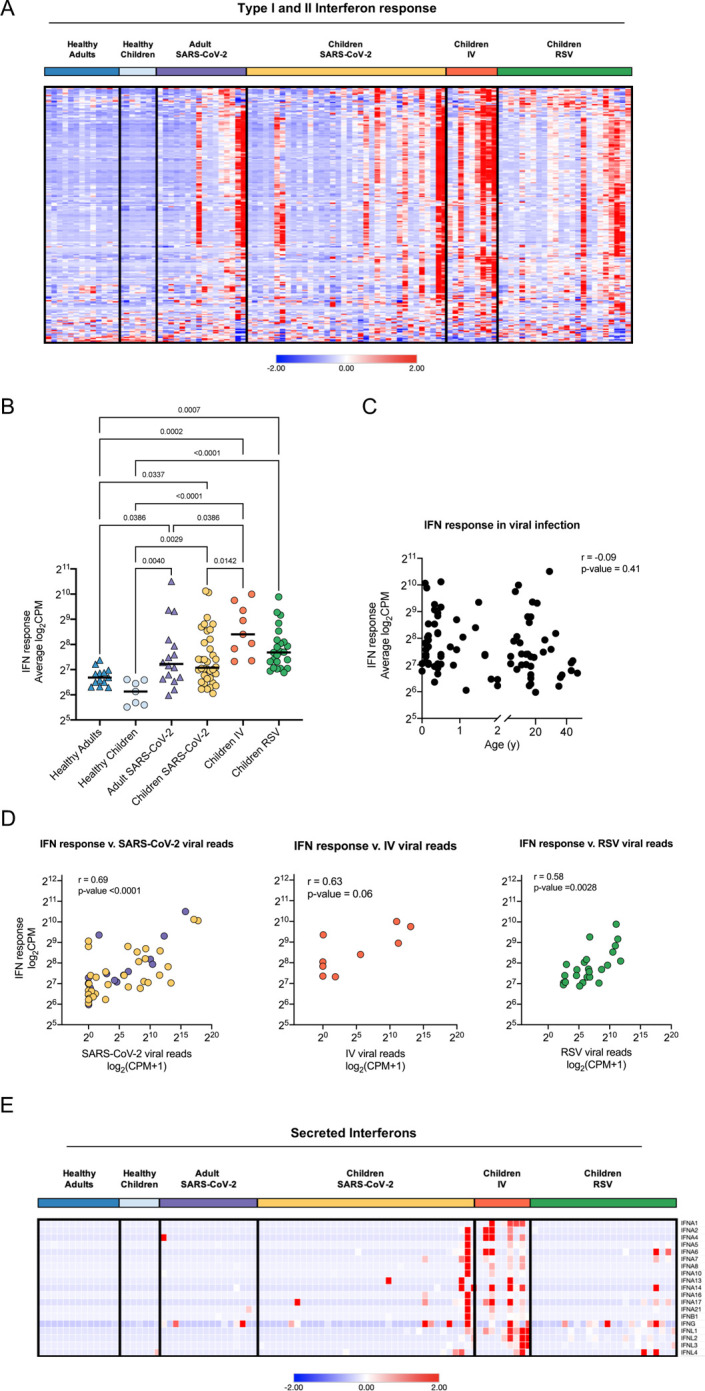
Figure 5. Local interferon response is independent of age and virus.

A. Heatmap of z-score normalized expression (CPM) of 222 Type I and II IFN response genes. Hierarchical clustering on genes (rows) did not identify distinct clusters. Samples within SARS-CoV-2, IV, and RSV groups are ordered by ascending viral reads for SARS-CoV-2, IV, or RSV, respectively. B. Average normalized expression of IFN response genes (combined Hallmark pathway lists for IFNA and IFNG response) by participant group. Asterisks indicate statistical significance (adjusted p-value <0.05, Kruskal-Wallis test with Benjamini-Hochberg FDR correction). C. Scatter plot of correlation between age (years) and average IFN response reads. Log-transformed CPM counts are shown. Pearson correlation coefficient (r) and p-value are shown. D. Scatter plot of correlation between average IFN response reads (log2CPM) and SARS-CoV-2, RSV, or IV viral loads, respectively. Pearson r-values and p-values are shown. E. Heatmap of z-score normalized expression (CPM) for 19 secreted Type I, II, and III interferons.
