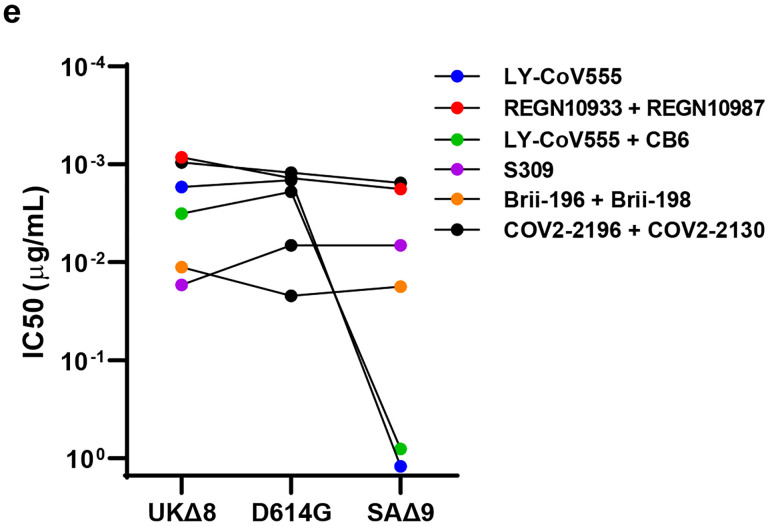
Fig. 2 |. Susceptibility of UKΔ8 and SAΔ9 pseudoviruses to neutralization by mAbs.
a, Footprints of neutralizing mAbs on the RBD. Left panel, top view of SARS-COV-2 spike with one RBD in the “up” conformation (pdb: 6zgg). RBD and NTD are colored green and peach, respectively. The positions of ‘inner’ and ‘outer’ sides are indicated on the “up” RBD with the ACE2-binding site colored yellow. The three panels to the right show the antibody footprints on RBD. b, Neutralization of UKΔ8, SAΔ9, and WT pseudoviruses by select RBD mAbs. c, Fold-change in IC50 of neutralizing mAbs against UKΔ8 and SAΔ9, as well as single-mutation pseudoviruses, relative to WT. MPI↓ denotes that maximum percent inhibition is substantially reduced, confounding IC50 calculations. d, Neutralization of UKΔ8, SAΔ9, and WT pseudoviruses by NTD-directed mAbs, the footprints of which are delineated by the color tracings in the insert. e, Changes in neutralization IC50 of authorized or investigational therapeutic mAbs against UKΔ8 and SAΔ9. Data in b and d are mean ± SEM of technical triplicates, and represent one of two independent experiments.


