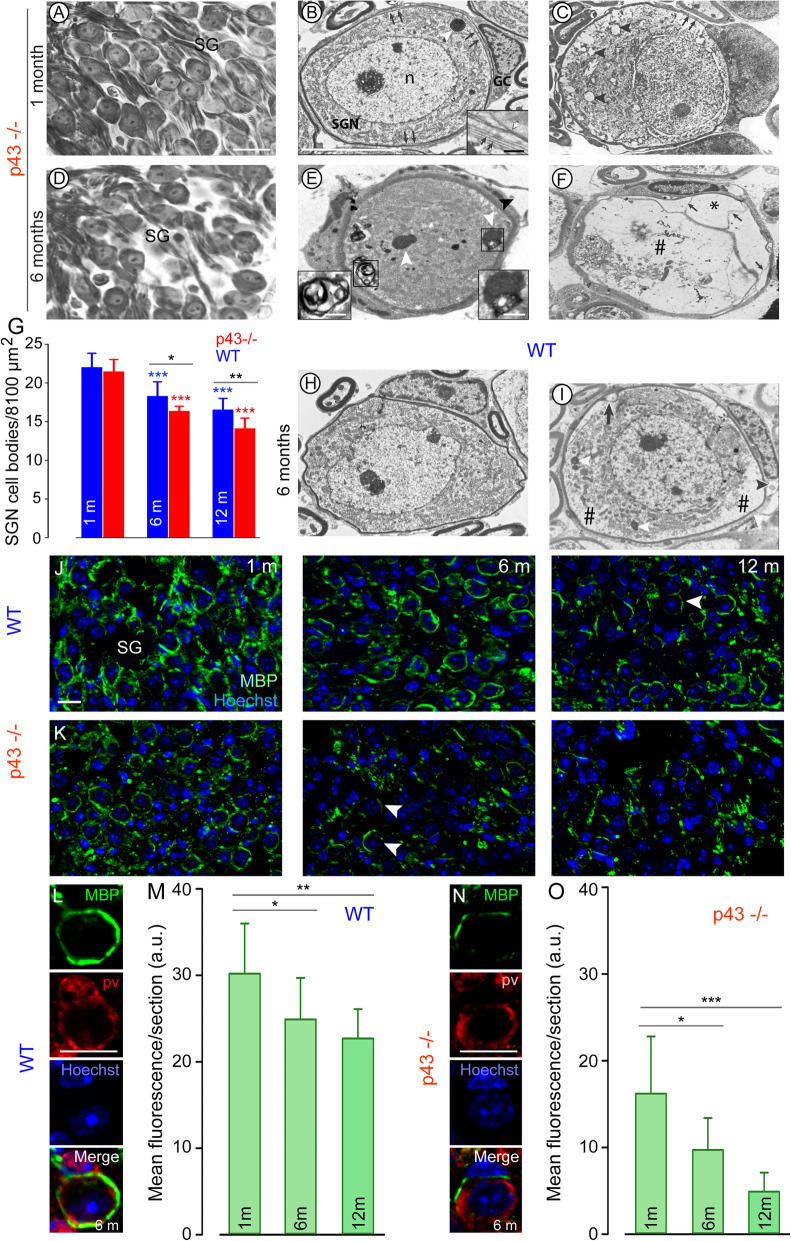
Fig. 3.
Degeneration of the spiral ganglion neurons and their glial cells. Representative light (a, d), transmission electron (b, c, e, f, h, i) and confocal (j, k, l, n) micrographs showing the spiral ganglion neurons and their glial cells from p43−/− (a–f, k, n) and WT mice (h, i, j, l), quantitative analysis of SGN density (g) and semi-quantitative analysis of and MBP expression (m, o). a–c 1 month of age p43−/− mice. a Micrograph showing a normal ganglion cell density. b The spiral ganglion neuron (SGN) have a healthy appearance. In the glial cells (GC), the myelin sheath is disorganized (arrows). Inset in b Disorganized myelin sheath (white arrow) with several layers of non-compacted myelin (black arrows). n, nucleus of the SGN. c The cytoplasm of the SGN shows numerous autophagic vesicles (arrowheads) and a ring of perinuclear edema. Arrows indicate disrupted myelin. d–f 6 months of age p43−/− mice. d A decrease in ganglion cell density is shown. e The SGN has condensed cytoplasm, a number of dark inclusions (white arrowheads) resembling lipofuscin aggregates and also a typical autophagy double-membrane vesicle (delineated by the black square). Note the detached myelin sheath from its cell body. Black arrowhead indicates a glial cell with large vacuoles in the cytoplasm. Right Inset shows a dark inclusion with a lipid droplet (delineated by the black square in e). Left Inset: shows an autophagy double-membrane vesicle. f The SGN cytoplasm shows large areas of autolysis (#). The glial cell still surrounds the remnants of the SGN but the myelin envelope is cleaved leading to large empty spaces between the myelin sheets (asterisk). Note the strands of isolated myelin sheets (arrows) and the autophagic vacuole in the glial cell. h, i 6 months of age WT mice. h A healthy appearing SGN surrounded by a normal looking glial cell with well compacted myelin sheath. I The cytoplasm of the SGN presents areas of autolysis (#) and dark inclusions (white arrowheads). The glial cell shows an autophagic vacuole (arrowhead). The myelin sheath is cleaved (arrow) in several segments. Scale bars: a, d = 20 μm, b, c, e, f, h, i = 10 μm. Insets in b, e = 0.5 μm. g Histogram representing the average SGN density in Rosenthal’s canal of the basal region from p43−/− (red bars) and WT (blue bars) aged 1, 6, and 12 months. Data are expressed as mean ± SD (n = five sections per cochlea, 7 to 9 cochleae per age and strain). One-way ANOVA test was followed by Dunn’s test (*P = 0.03, **P ≤ 0.01, p43−/− vs. WT of the same age; ***P ≤ 0.001, older p43−/− vs. 1-month-old p43−/−; ***P ≤ 0.001, older WT vs. 1-month-old WT). j, k, l, n Confocal images showing the basal region of spiral ganglion (SG) immunolabeled for parvalbumin (PV) to identify SGNs (red, not shown in j and k), and MBP (green) to highlight myelin sheaths, and counterstained with Hoechst (blue) to identify nuclei from WT (j, l), and p43−/− (k, n) aged 1, 6, and 12 months (left, middle and right columns respectively). Higher magnification images in l and n show representative intact (l) and partial loss of (n) MBP positive myelin sheaths enveloping the neurons from WT (l) and p43−/− (n) mice aged 6 months. Scale bars = 20 μm. m, o: Semi-quantitative analysis of the MBP immunofluorescence. Mean immunofluorescence of myelin per section as a function of age, for WT (m) and p43−/− (o). Data are expressed as mean ± SD (n = 3 sections per cochlea, 4 cochleae per age and strain). Wilcoxon test (*P ≤ 0.05, **P ≤ 0.01, ***P ≤ 0.001)

