Fig. 6.
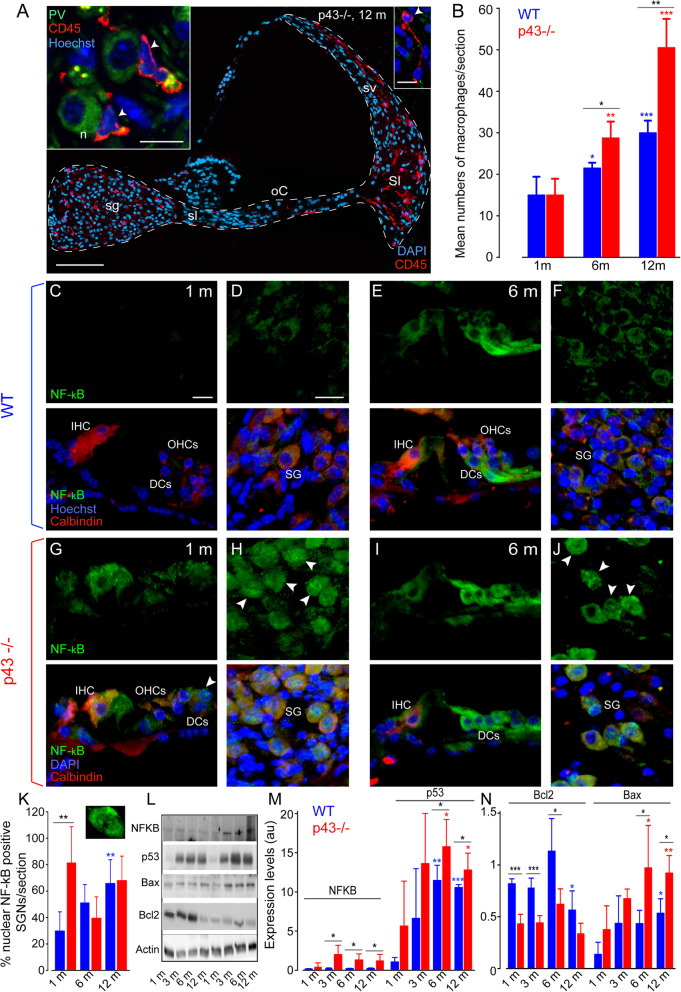
Macrophage invasion, pro-apoptotic protein expression. a: confocal images of transverse cryostat sections of the cochleae from p43−/− mice at 12 months. The sections were immunolabeled for CD45 (red), allowing macrophage detection and for parvalbumin (PV, green) to identify the SGNs, and counter-stained with Hoechst to label nuclear chromatin (blue). Note dramatic invasion of CD45 positive macrophages in the spiral ganglion (sg), the spiral lamina (sl), the organ of Corti (oC), the spiral ligament (Sl), and the stria vascularis (sv) of 12-month-old p43−/−. The left inset shows macrophages (red) surrounding the SGNs and the right inset, those in the spiral ligament. White arrowheads indicate macrophages. Scale bars: a = 100 μm, left inset = 20 μm, right inset = 10 μm. n, neuron. b Histogram representing the average number of macrophages per section from the transverse sections of the cochlear basal region of both WT (blue bars) and p43−/− (red bars) aged 1, 6, and 12 months. Data are expressed as mean ± SD (n = 4 or 5 sections per cochlea, 4 cochleae per age and strain). One-way ANOVA test was followed by Dunn’s test (*P ≤ 0.05, **P ≤ 0.01, p43−/− vs. WT of the same age; **P ≤ 0.01, ***P ≤ 0.001, older p43−/− vs. 1-month-old p43−/−; *P ≤ 0.05, ***P ≤ 0.001, older WT vs. 1-month-old WT). c–j Confocal images of transverse cryostat sections of the organ of Corti (c, e, g, and i), and spiral ganglion (SG, d, f, h, and j) at 1 (c, d, g, and h) and 6 months (e, f, i, and j) from WT and p43−/− mice. The sections were labeled for NF-κB (green), and for calbindin (red) to identify the hair cells and SGNs, and counter-stained with Hoechst dye (blue). Note massive nuclear translocation of NF-κB in the SGNs of p43−/− mice aged 1 month (h). White arrowheads indicate nuclear NF-κB-positive SGNs. Scale bars: c, g, e, i = 10 μm, d, h, f, j = 20 μm. DCs, Deiters cells. k Histogram representing the percentage of nuclear NFκB-positive SGNs per section from the transverse sections of the cochlear basal regions of both WT (blue bars) and p43−/− (red bars) aged 1, 6, and 12 months. Data are expressed as mean ± SD (n = 4 or 5 sections per cochlea, 5 cochleae per age and strain). One-way ANOVA test was followed by Dunn’s test (**P ≤ 0.01, p43−/− vs. WT of the same age; **P ≤ 0.01, older WT vs. 1-month-old WT). l Representative western blot analysis using antibodies against NF-κB, p53, Bax, Bcl2 and β-actin in whole cochlear extracts from WT and p43−/− mice aged 1, 3, 6, and 12 months. m, n Histograms representing the levels of NF-κB, p53, Bcl2 and Bax in WT (blue bars) and p43−/− (red bars). β-actin served as a loading control. Data are expressed as mean ± SD (each experiment was performed with a pool of 8 cochleae per sample per age and per strain, and in biological and technical triplicate). One-way ANOVA test was followed by Dunn’s test (*P ≤ 0.05, ***P ≤ 0.001, p43−/− vs. WT of the same age; *P ≤ 0.05, **P ≤ 0.01, older p43−/− vs. 1-month-old p43−/−; *P ≤ 0.05, **P ≤ 0.01, ***P ≤ 0.001, older WT vs. 1-month-old WT)

