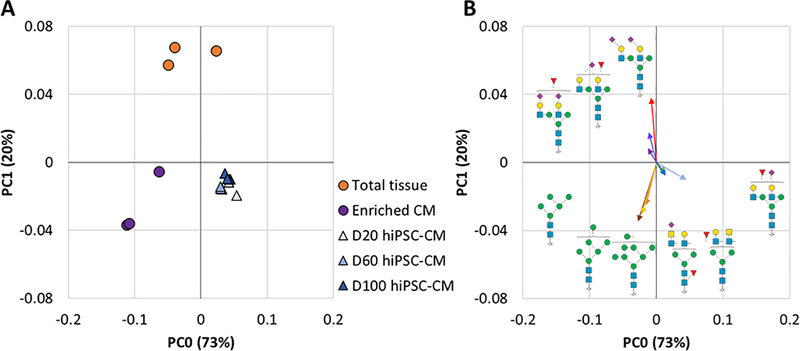
Figure 6.
PCA analysis of N-glycan profiles from heart tissue homogenate (n=3), primary enriched CM (donor matched, n=3), and hiPSC-CM (n=3 for each time-point). A PCA plot of total N-glycome profiles for all sample types covering 93% of all observed variation. B Loading plot showing major N-glycan structure contributors to each cluster plotted with vectors (line length and angle) proportional to PCA dimension contribution strength and direction.

