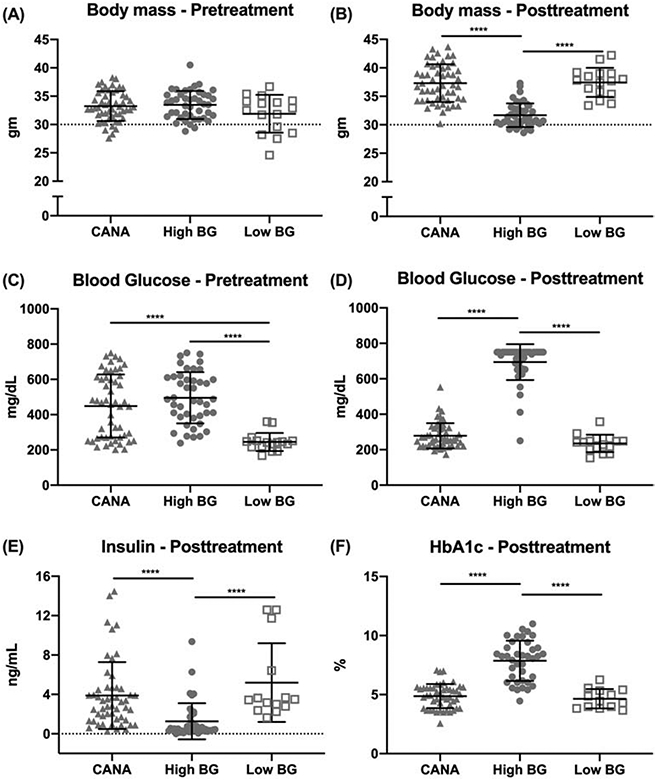
Figure 1: Differences in selected physiological measurements at pre-treatment or post-treatment.

Pre-treatment body mass was similar among the 3 groups (A); 10-12-weeks later, untreated mice with high blood glucose (BG) weighed less than CANA-treated mice or mice with low blood glucose (B). Average pre-treatment BG was significantly elevated in both the CANA-treated and High BG groups, compared with the designated Low BG group (C); 10-12-weeks later, BG was similar between CANA-treated mice and Low BG mice (D). [Fig. 1D shows 1 outlier for the High BG cohort, with a post-treatment BG of 250 mg/dL. For this mouse, BG at the time of group assignment was 493 mg/dL with subsequent measurements of 505, 363, 399, and 368 mg/dL throughout the study. Because the average BG for study duration was 394 mg/dL, this mouse was retained in the High BG group despite an inconsistent final BG reading.] Accompanying the reduction in BG, circulating insulin (E) and HbA1c (F), a marker of glycemic control, was higher and lower, respectively, for CANA-treated than untreated mice with high BG. Group mean ± SD is shown. **** p<0.0001.
