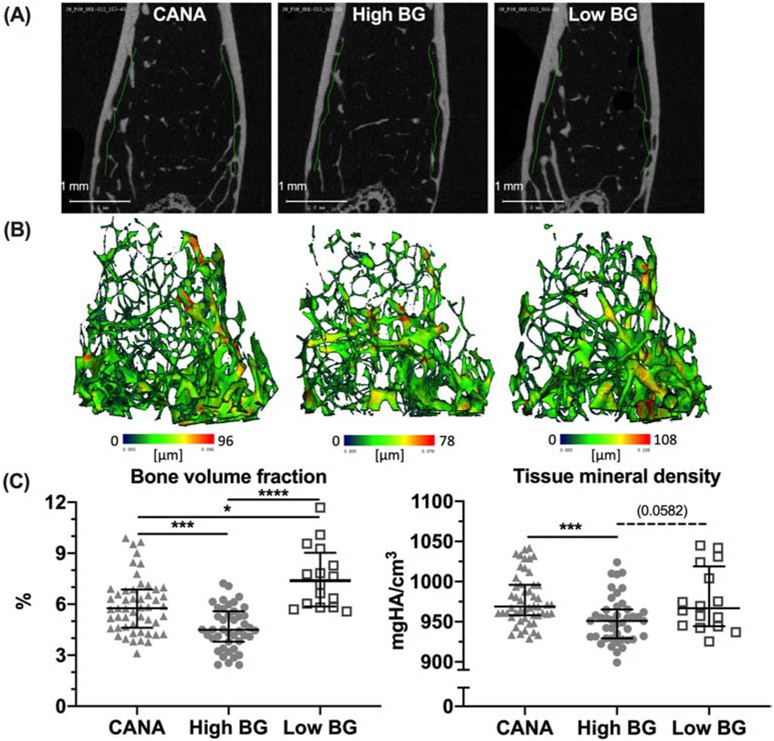
Figure 3: Differences in trabecular bone architecture and mineral density.
Representative micro-computed tomography evaluations of distal femur metaphysis are shown for the 3 groups (A) along with 3D renderings of the compartment with blue indicating low trabecular thickness and red indicating high trabecular thickness (B). There was less trabecular bone volume fraction (BV/TV) in the High BG group compared to the Low BG group and CANA group; CANA-treatment partially rescued BV/TV (C). Tissue mineral density of the trabecular bone (Tb.TMD) was also less in the High BG group compared to the other groups with no difference between CANA-treated and Low BG mice (D). Group median with the intra quartile range is shown. **** p<0.0001; ***p<0.001; *p<0.05; and dashed line when adjusted p-value was greater than 0.05 but less than 0.1.

