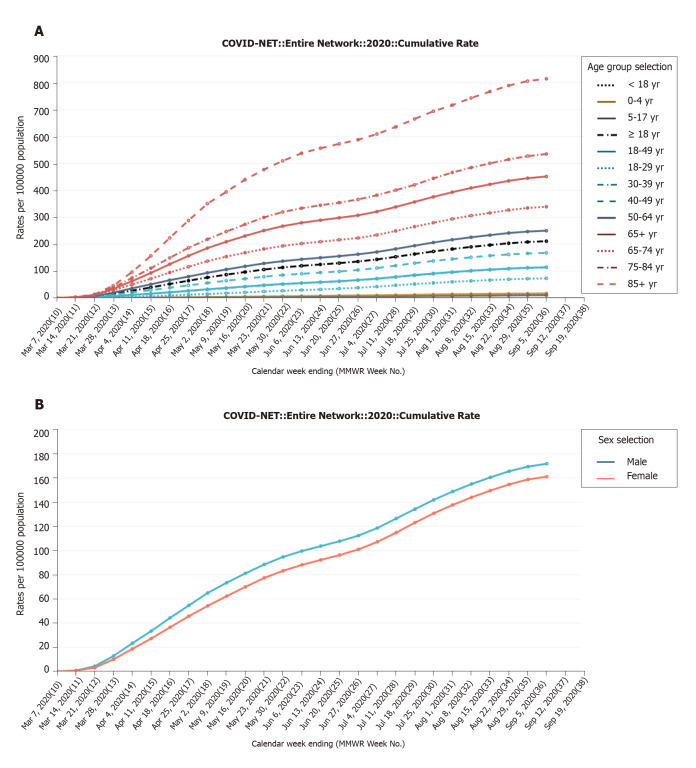
Figure 1.
Cumulative rate of infection per 100000 population. A: In different age groups under the Coronavirus Disease-2019 (COVID-19)-Associated Hospitalization Surveillance Network (COVID-NET) hospitalization data (by September 5, 2020; https://gis.cdc.gov/grasp/COVIDNet/COVID19_3.html); B: In gender-based fatality rate under the COVID-19-Associated Hospitalization Surveillance Network (COVID-NET) hospitalization data (by September 5, 2020; https://gis.cdc.gov/grasp/COVIDNet/COVID19_3.html).

