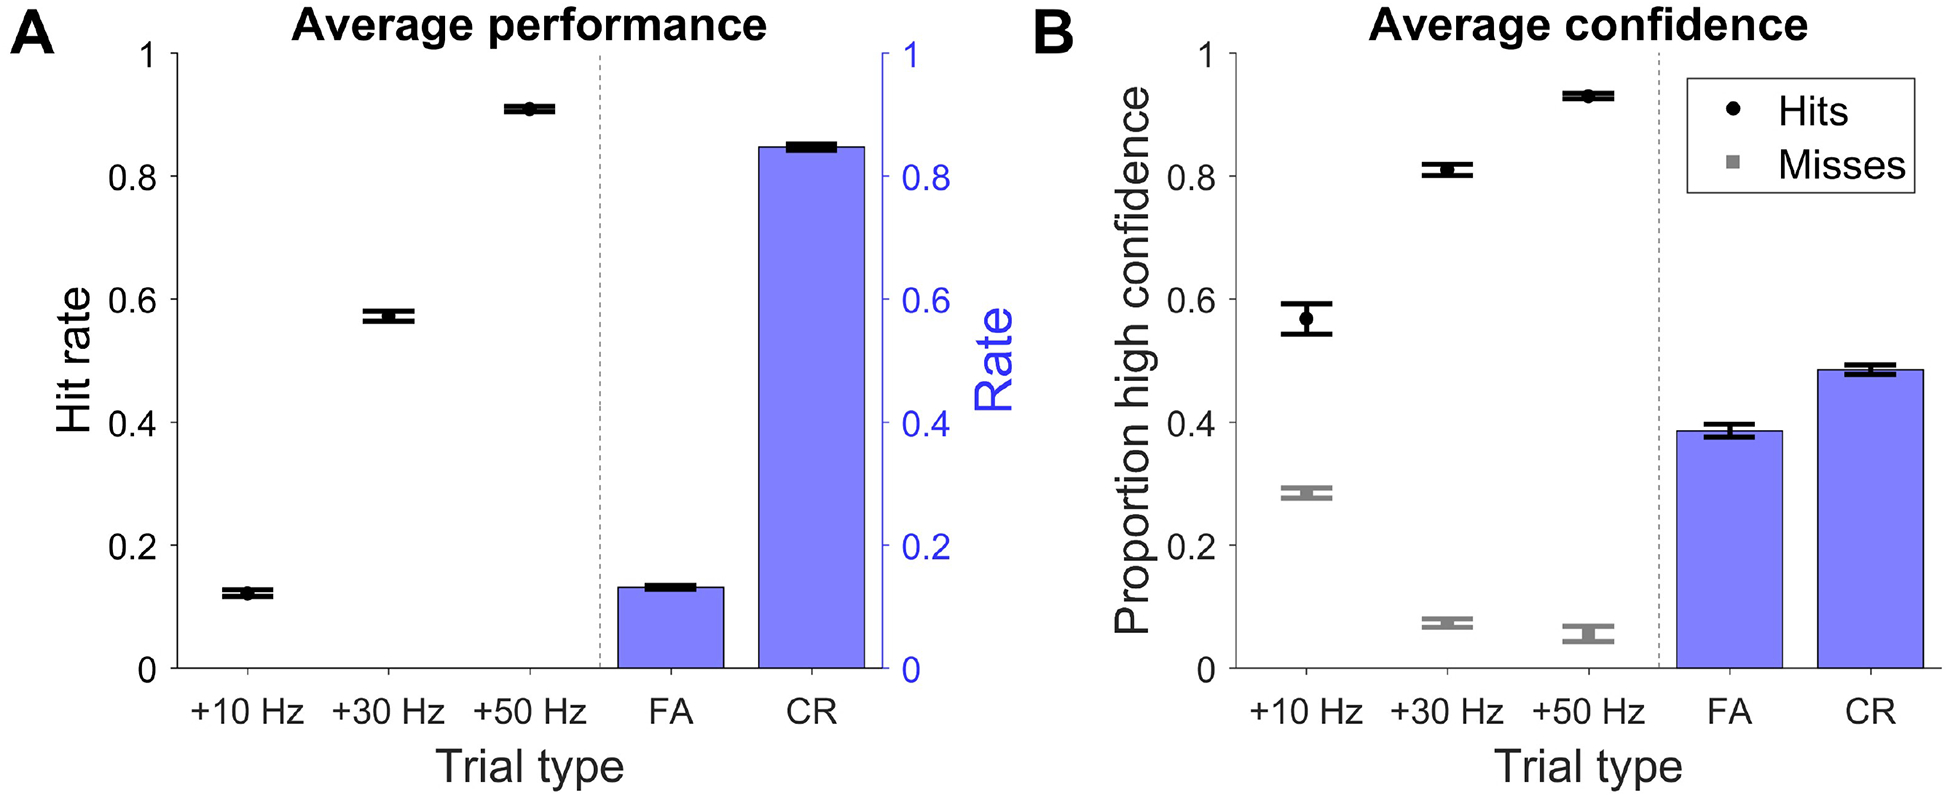
Figure 2. Task performance and confidence ratings:

A, Combined data from 7 subjects showing performance as a function of the change in click rate (left) and proportion of FA and CR trials (right). Hit rate was calculated excluding FA trials. FA rate was calculated from all trial types. CR rate was calculated from trials in which no change in generative click rate occurred (30% of trials). B, Proportion of high confidence hits (black) and misses (gray) as a function of change in click rate (left) and proportion of high confidence FA and CRs (right). Error bars indicate +/− SEM. See Figure S1.
