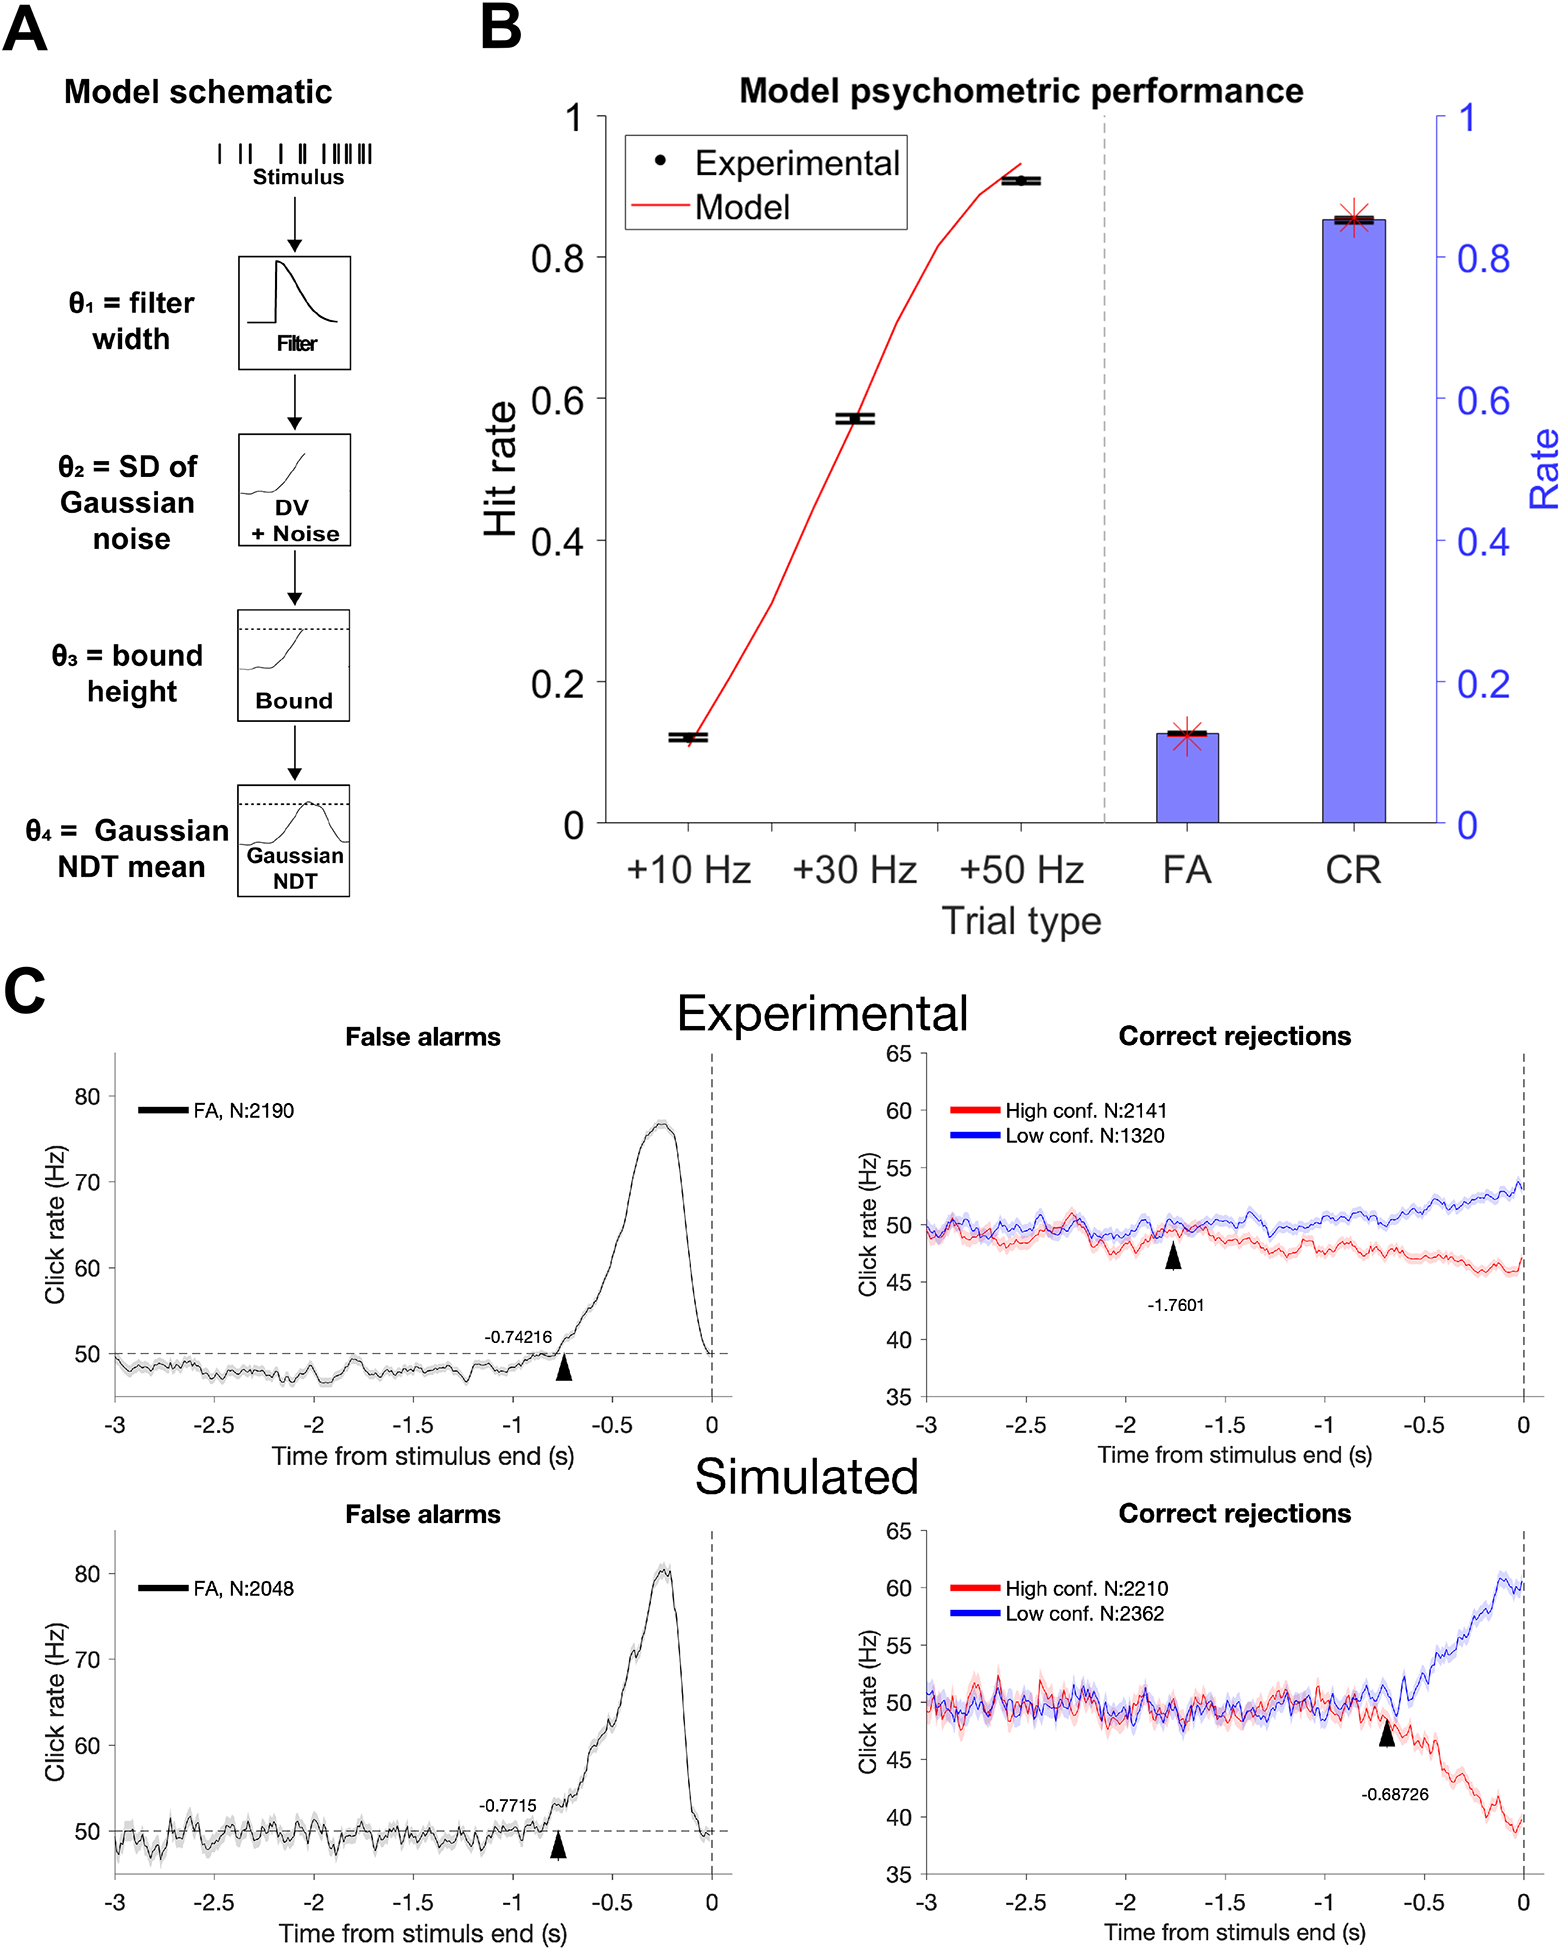
Figure 4. Model simulation of behavioral data:

A, Model schematic. The model included four free parameters: width of half-Gaussian filter (0.96 s), decision variable noise term standard deviation (13 Hz), decision bound (103 Hz), and mean Gaussian NDT (0.17 s). Best fit parameters are in parentheses. B, Model comparison with psychometric data based on best fit parameters. Error bars indicate +/− SEM (as in Fig. 2). The red line indicates model hit rate as a function of change in click rate, with additional interpolated delta click rates (+15 Hz, +20 Hz, +25 Hz, +35 Hz, +40 Hz, +45 Hz). Red stars indicate FA and CR rates for the model. C, Experimental and simulated RCs. See Figure S4.
