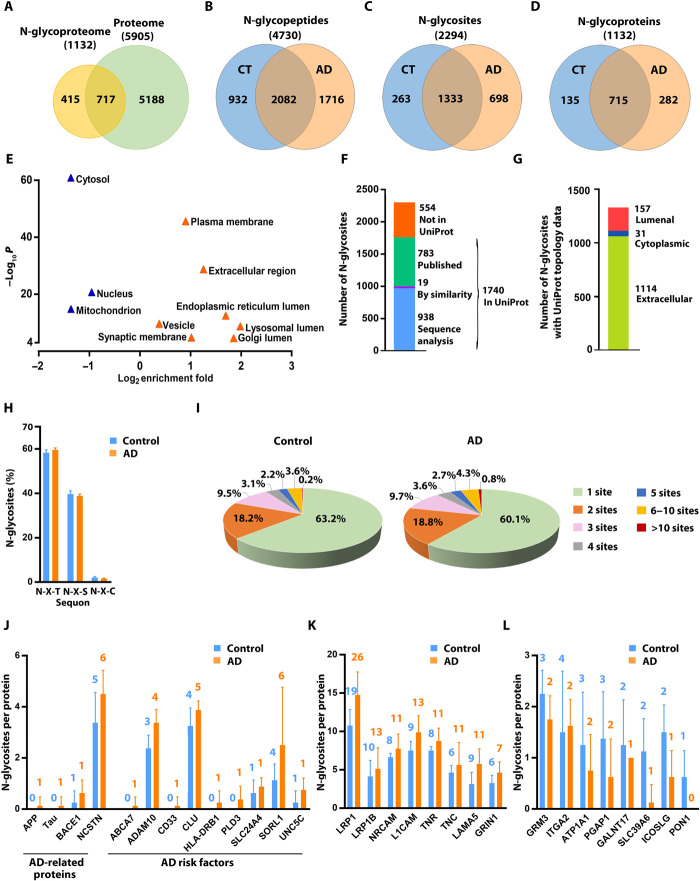
Fig. 1. Quantitative N-glycoproteomics analysis of AD and control brains.
(A) Venn diagram comparison of identified proteins in human brain N-glycoproteome versus proteome. (B to D) Comparisons of identified N-glycopeptides (B), N-glycosites (C), and N-glycoproteins (D) in AD versus control (CT) brains. (E) GO localization categories enriched or underrepresented in the N-glycoproteome compared to the proteome with Benjamini-Hochberg false discovery rate (FDR)–corrected P < 0.0001. (F) Match of the identified N-glycosites to UniProt database of annotated N-glycosites. (G) Mapping of the identified N-glycosites to proteins with UniProt-annotated topology. (H) Distribution of the identified N-glycosites with the indicated tripeptide sequon is shown as means ± SD (n = 8 cases per AD or control group). (I) Pie charts showing the proportions of singly and multiply N-glycosylated proteins with the indicated number of in vivo N-glycosites per protein in AD and controls. (J to L) Bar graphs showing the number of N-glycosites identified on AD-related proteins and risk factors (J) and examples of identified glycoproteins with increased (K) or reduced (L) number of in vivo N-glycosites in AD compared to controls. Data are shown as means ± SD (n = 8 cases per group), and the total number of identified N-glycosites per protein is indicated above each bar.

