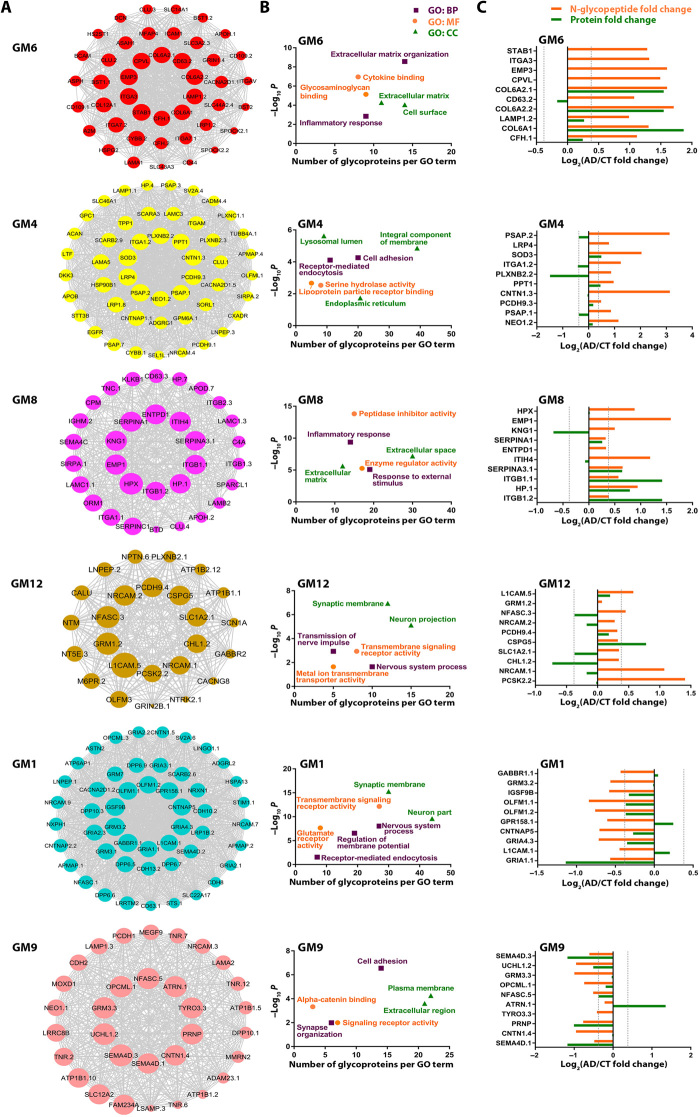
Fig. 5. Network depiction and analyses of AD-associated glyco-network modules.
(A) N-glycopeptide co-regulation network plots of AD-associated modules with top 10 hub glycopeptides/glycoproteins shown in the center of each plot. The size of nodes corresponds to kME-based intramodular connectivity, and a maximum of top 50 glycopeptides are shown for each module. The full list of N-glycopeptide sequences and corresponding N-glycoproteins and N-glycosites in each module and their kME values are provided in table S6A. (B) Top GO biological process (BP), molecular function (MF), and cellular component (CC) categories enriched in each AD-associated module are shown by Benjamini-Hochberg FDR-corrected P values (−log10 scale) and plotted against the number of glycoproteins per GO term. (C) N-glycopeptide abundance fold changes in AD versus control for top 10 hub glycopeptides in each AD-associated module are shown with their corresponding protein abundance changes measured by proteomics.

