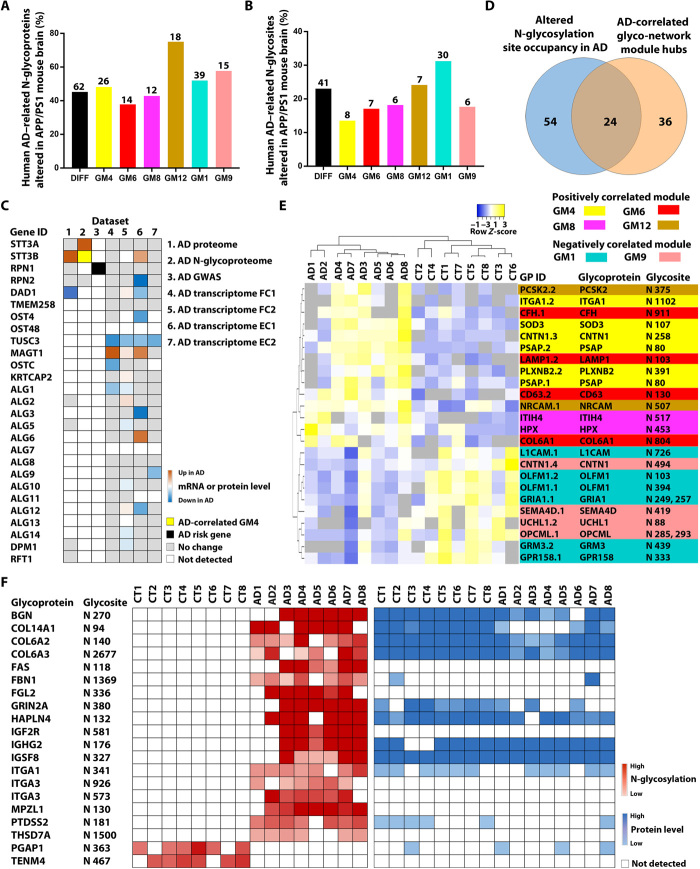
Fig. 6. Integrative analyses to identify potential causes of altered N-glycosylation in AD and N-glycopeptide biomarkers.
(A and B) Comparison of N-glycoproteome data between human AD and APP/PS1 mouse brains shows the percentages (bars) and the numbers (indicated above each bar) of the identified human AD–related N-glycoproteins (A) and N-glycosites (B) that were altered in the APP/PS1 mouse brain for the differential N-glycosylation datasets (DIFF) and each of human AD–correlated glyco-network modules. (C) Integration of seven datasets reveals disease-associated changes in N-glycosylation–related genes/proteins in human AD cases. AD transcriptome FC1 and FC2 are datasets from the frontal cortex, and EC1 and EC2 are from the entorhinal cortex. (D) Venn diagram showing the overlap between glycopeptides with altered N-glycosylation site occupancy in AD and top hub glycopeptides of AD-associated glyco-network modules. (E) Unsupervised hierarchical clustering based on the glycopeptide abundance profiles of the identified 24 hub glycopeptides with altered N-glycosylation site occupancy, showing clear separation of AD from control cases and of positively correlated glyco-network module hubs from negatively correlated module hubs. (F) Heatmaps showing the abundances of 20 glycopeptides containing N-glycosite with a gain or loss of N-glycosylation in AD and their corresponding protein abundances measured from proteomics analysis.

