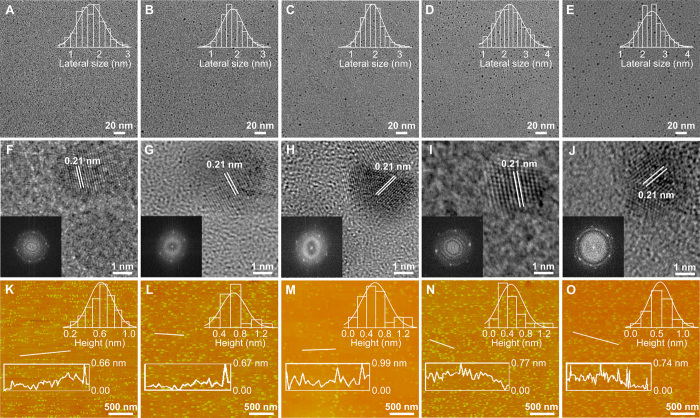
Fig. 2. Morphological characterizations of selected CQDs.
(A to E) TEM images and corresponding lateral size distributions of b-CQDs (A), c-CQDs (B), yg-CQDs (C), o-CQDs (D), and r-CQDs (E). (F to J) High-resolution TEM images of b-CQDs (F), c-CQDs (G), yg-CQDs (H), o-CQDs (I), and r-CQDs (J) (inset: fast Fourier transform patterns). (K to O) AFM images and corresponding height profiles of b-CQDs (K), c-CQDs (L), yg-CQDs (M), o-CQDs (N), and r-CQDs (O).

