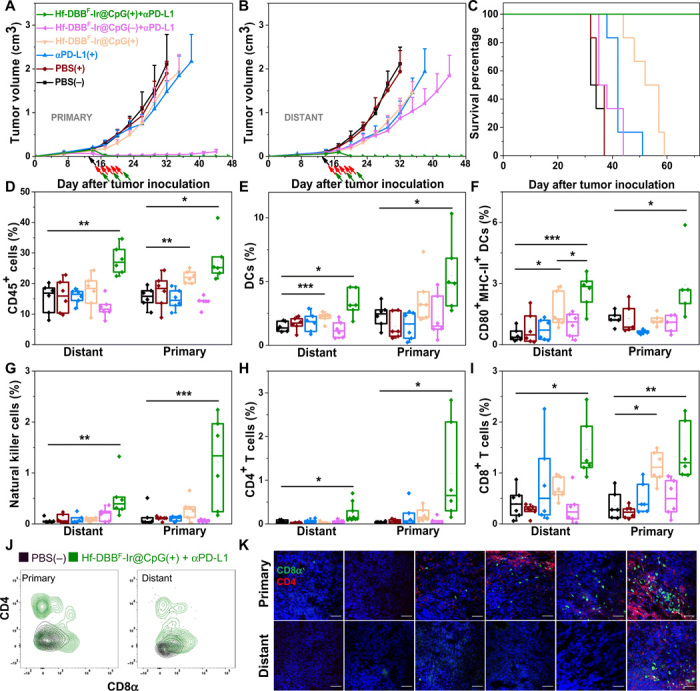
Fig. 5. Abscopal effect of in situ cancer vaccination synergized CBI with promoted adaptive immunity.

Primary treated (A), distant untreated (B) tumor growth curves, and survival curves (C) of MC38 tumor-bearing mice treated with PBS(−), PBS(+), αPD-L1(+), Hf-DBBF-Ir@CpG(+), Hf-DBBF-Ir@CpG(−) + αPD-L1, or Hf-DBBF-Ir@CpG(+) + αPD-L1. Treatment began on day 14 after tumor inoculation when the tumor reached a volume of 100 to 150 mm3. X-ray irradiation was carried out on mice 12 hours after the intratumoral injection of PBS or Hf-DBBF-Ir@CpG on five consecutive days at a dose of 1 Gy per fraction. Antibody was given intraperitoneally every 3 days at a dose of 75 μg per mouse. Black, red, and green arrows refer to the times of intratumoral injections, x-ray irradiation, and intraperitoneal injection, respectively; n = 6. The percentages of tumor-infiltrating CD45+ cells (D), DCs (E), CD80+ MHCII+ DCs (F), NK cells (G), CD4+ T cells (H), and CD8+ T cells (I) with respect to the total cells 10 days after treatment. Data are expressed as means ± SD (n = 6). *P < 0.05, **P < 0.01, and ***P < 0.001 by t test. Central lines, bounds of box, and whiskers represent means, 25 to 75% of the range of data, and 1.5-fold of interquartile range away from outliers, respectively. (J) Representative flow cytometric plots showing infiltration of CD4+ and CD8+ T cells on both primary and distant tumors treated by PBS(−) or Hf-DBBF-Ir@CpG(+) + αPD-L1 shown in black or green contours, respectively. (K) Representative pictures showing the infiltration of T cells on excised tumor section slides. Blue, green, and red fluorescence represent DAPI, CD8α, and CD4, respectively. Scale bars, 50 μm.
