Figure 5.
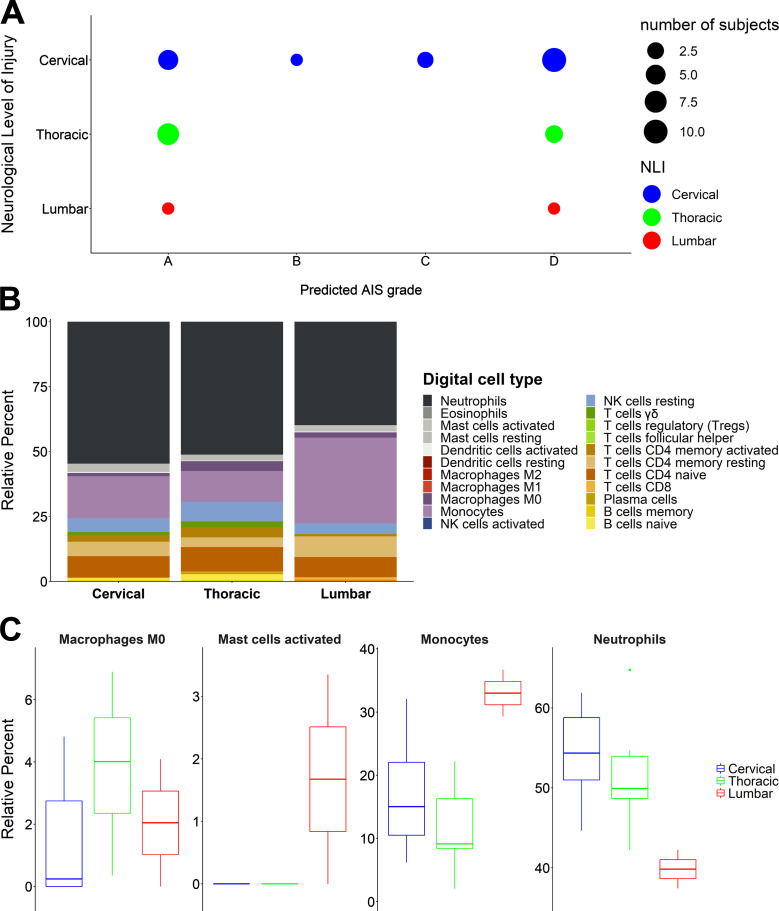
NLI is correlated with a differential immunological response after SCI. (A) The distribution of the NLI levels across the predicted AIS grades does not show a pattern that would suggest a strong effect on the predictability of the model. (B) CIBERSORTx data aggregated per NLI. The stacked bar plots show the differential immune response for each NLI level. (C) One-way ANOVA for each digital cell type from B showed that several cell types displayed a statistically significant differential response per NLI. The four cell types presented here are the ones remaining significant (P < 0.05) after Benjamini–Hochberg multiple testing correction (cervical = 18, thoracic = 10, lumbar = 2).

