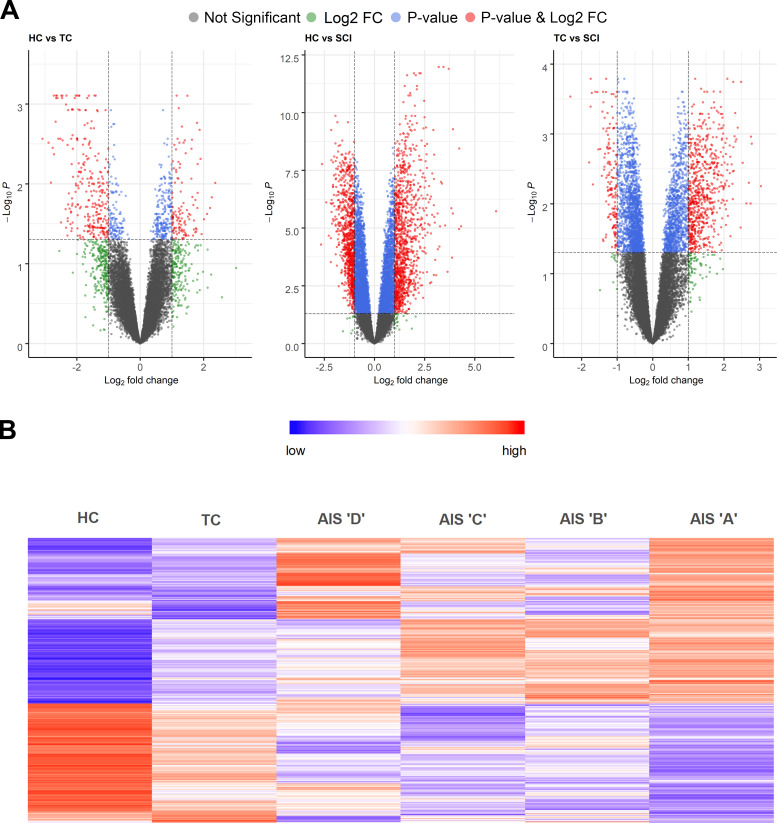
Figure S2.
Differential gene expression analysis of SCI patients vs. healthy and TCs reveals many genes induced specifically upon SCI. (A) Volcano plots of the three comparisons between HCs, TCs, and SCI patients. (B) Heatmap of the 2,096 differentially expressed genes after SCI but not trauma (fold-change [FC] >2, adjusted P value <0.05; HC = 10, TC = 10, AIS D = 11, C = 6, B = 4, A = 12).

