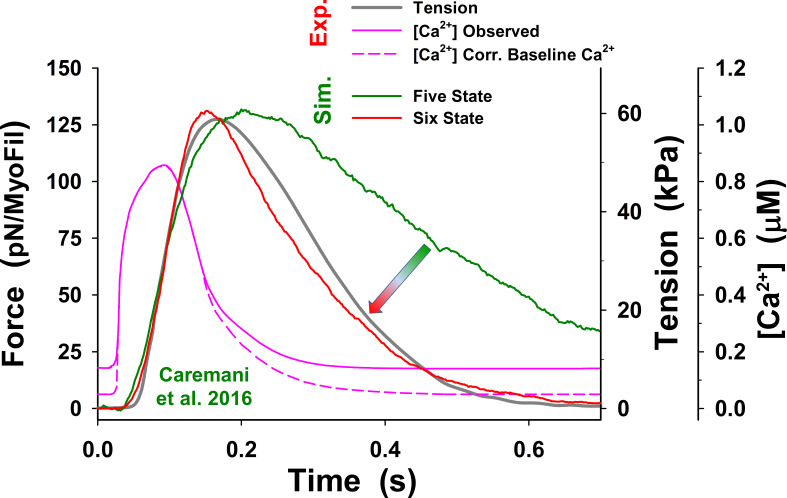
Figure 3.
Significance of the PS in twitch relaxation phase. The simulations of a half-sarcomere isometric twitch with the five-state model showed slow relaxation (dark green line) compared with adjusted observations of Caremani et al. (2016) (dark gray line), even when the baseline [Ca2+] was reduced (pink dashed line, denoted as Corr. Baseline). The simulations also predicted high muscle tone at observed baseline [Ca2+] (not shown), similar to that shown by Prodanovic et al. (2020) at comparable low [Ca2+]. In contrast, the simulations with the six-state model, which includes the PS, significantly increased speed of relaxation (indicated by arrow) and the model predictions (red line) matching adjusted tensions observed by Caremani et al. (2016) (dark gray line). Note that the observed tension is adjusted to truly isometric conditions at a half-sarcomere by subtracting passive tension caused by sarcomere lengthening due to length control malfunction (for the details of how the adjustment is obtained, see Fig. S3). Force is shown as an average force per myosin filament (MyoFil). In all simulations (Sim.), we used the same model parameters as shown in Table 1, except and which are presented in the text for the five-state model and in Table 2 for the six-state cross-bridge cycle. For comparison, mean force per myosin filament and corresponding (observed) muscle tension (Exp.) are shown on the vertical axes. For consistency in all plots, resting tension is subtracted; thus, the responses to calcium transient display net change in active tension.

