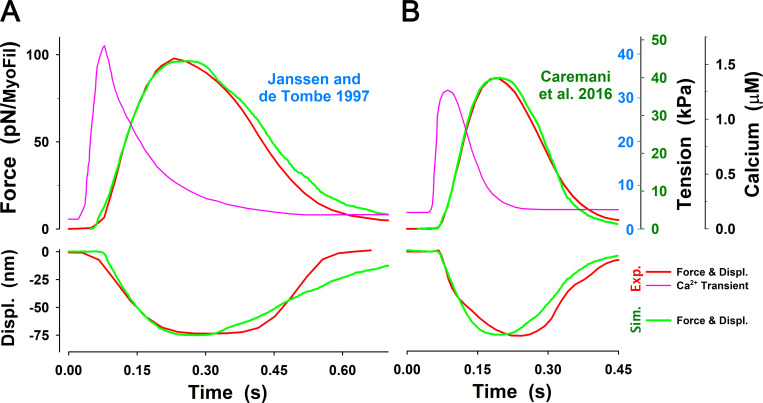
Figure 5.
The MUSICO simulation with the six-state model of twitch observed by Caremani et al. and Janssen and de Tombe. Related to Janssen and de Tombe, 1997; Caremani et al., 2016. (A) For the calcium transient observed by Janssen and de Tombe at 22°C (pink solid line), the MUSICO simulations (green solid lines) fitted well the observed force transient (red line). (B) A similar observation was made for the calcium transient observed by Janssen et al. at 27.5°C (pink solid line). The simulations (green solid lines) followed the tension transient observed by Caremani et al. (2016), at 27.2°C (red line). Both simulations also fitted well the shortening during rising tension phase (i.e., decrease in HS length, denoted as Displ.); however, during tension relaxation, the half-sarcomere lengthening is faster than observed. To achieve good fits for the transients at different temperatures (22°C versus 27.2°C) and with fixed and variable SLs, the cross-bridge rates and should be adjusted accordingly (see Table 2). The difference in tension axes between Janssen and de Tombe, 1997; Caremani et al., 2016, denoted as blue and green numbers, respectively, are a consequence of assessment of nominal cross-sectional area at different SLs that strongly affect the conversion factor between force per myosin filament in piconewtons and tension in kilopascals (see Appendix E).

